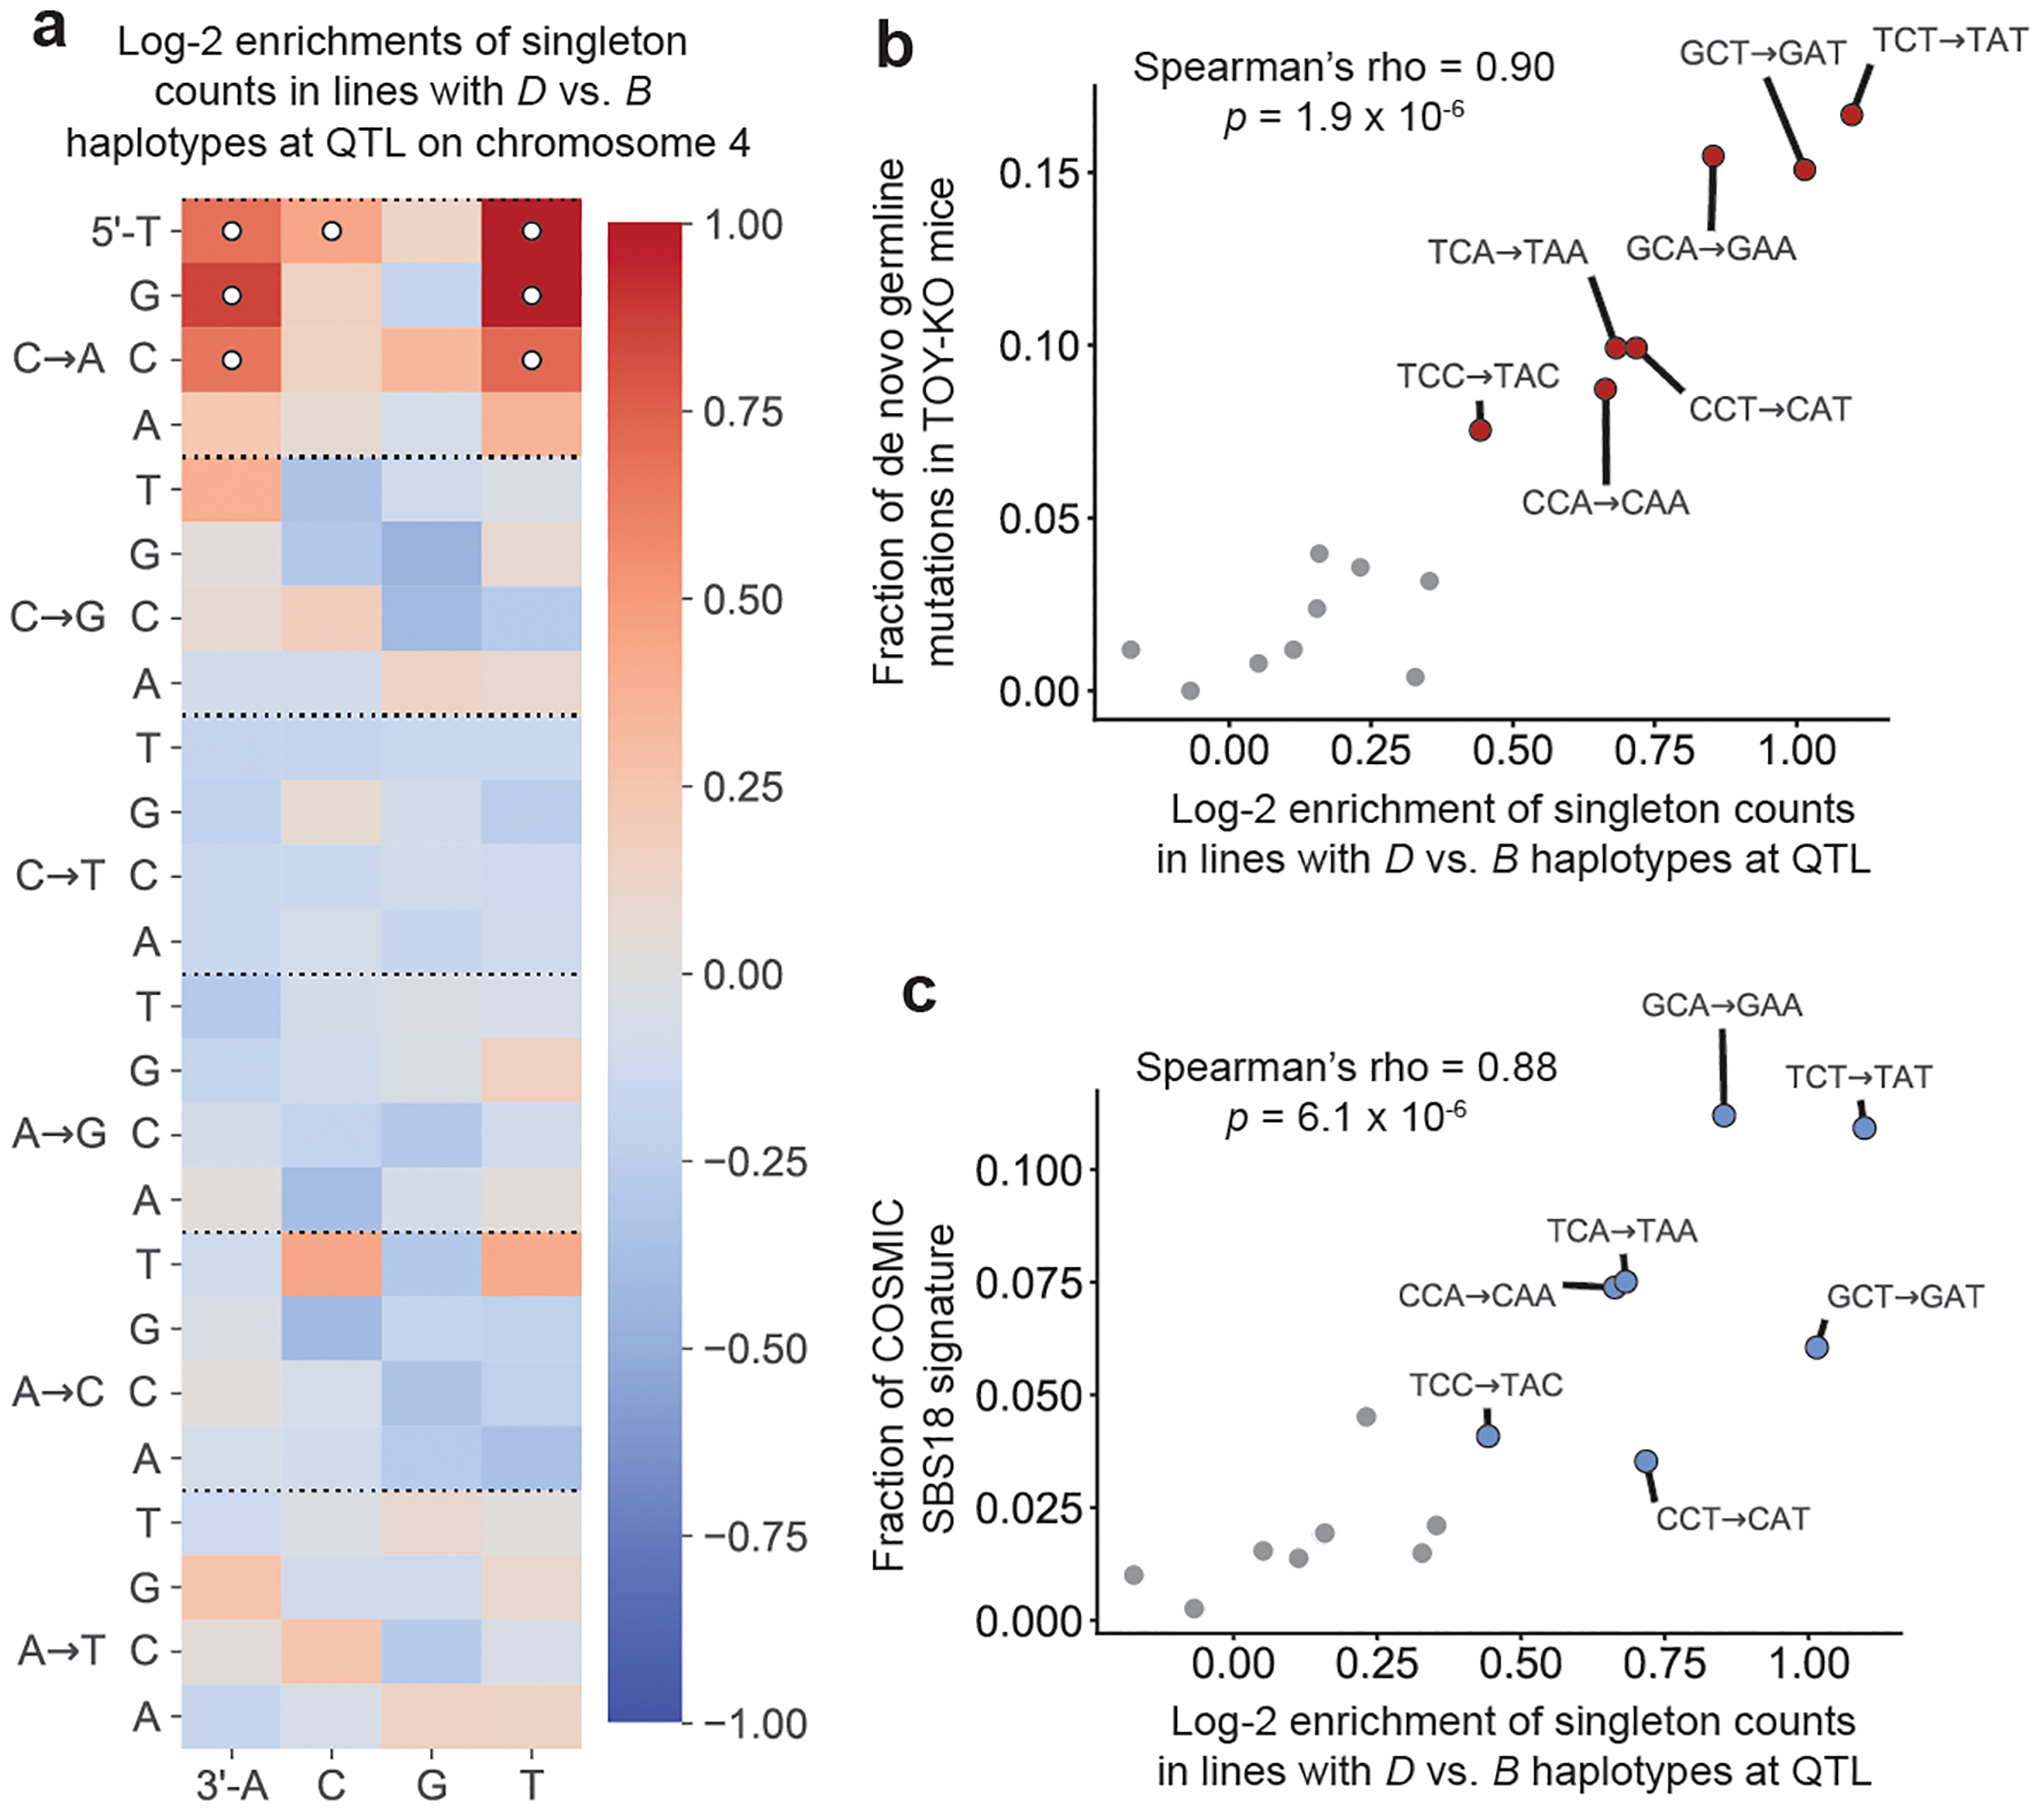
Fig. 3 |. Context-dependent C>A mutation enrichment in lines with the D haplotype at the C>A QTL.

a, log2 ratios of mutation fractions in lines with D haplotypes (n = 56 biologically independent mice) compared with lines with B haplotypes (n = 38 biologically independent mice) at the QTL on chromosome 4. Mutation types with Chi-square test of independence P < 0.05/96 (Bonferroni-corrected) are marked with white circles. b, The log2 enrichments of C>A mutations in each 3-mer context in D versus B lines from a are plotted against the relative abundances of C>A mutations in each context in a previously reported set of de novo mutations from Mutyh−/−Ogg1−/−Mth1−/− mice24 (n = 252 mutations). Correlation was quantified using the Spearman’s rank correlation coefficient (rho = 0.90, P = 1.9 × 10⁻⁶). 3-mer mutation types with significant enrichments labelled in a are coloured in red and outlined in black. c, The log2 enrichments of C>A mutations in each 3-mer context in D versus B lines from a are plotted against the relative abundances of C>A mutations in each context in the SBS18 COSMIC mutation signature. Correlation was quantified using the Spearman’s rank correlation coefficient (rho = 0.88, P = 6.1 × 10⁻⁶). 3-mer mutation types with significant enrichments labelled in a are coloured blue and outlined in black.
