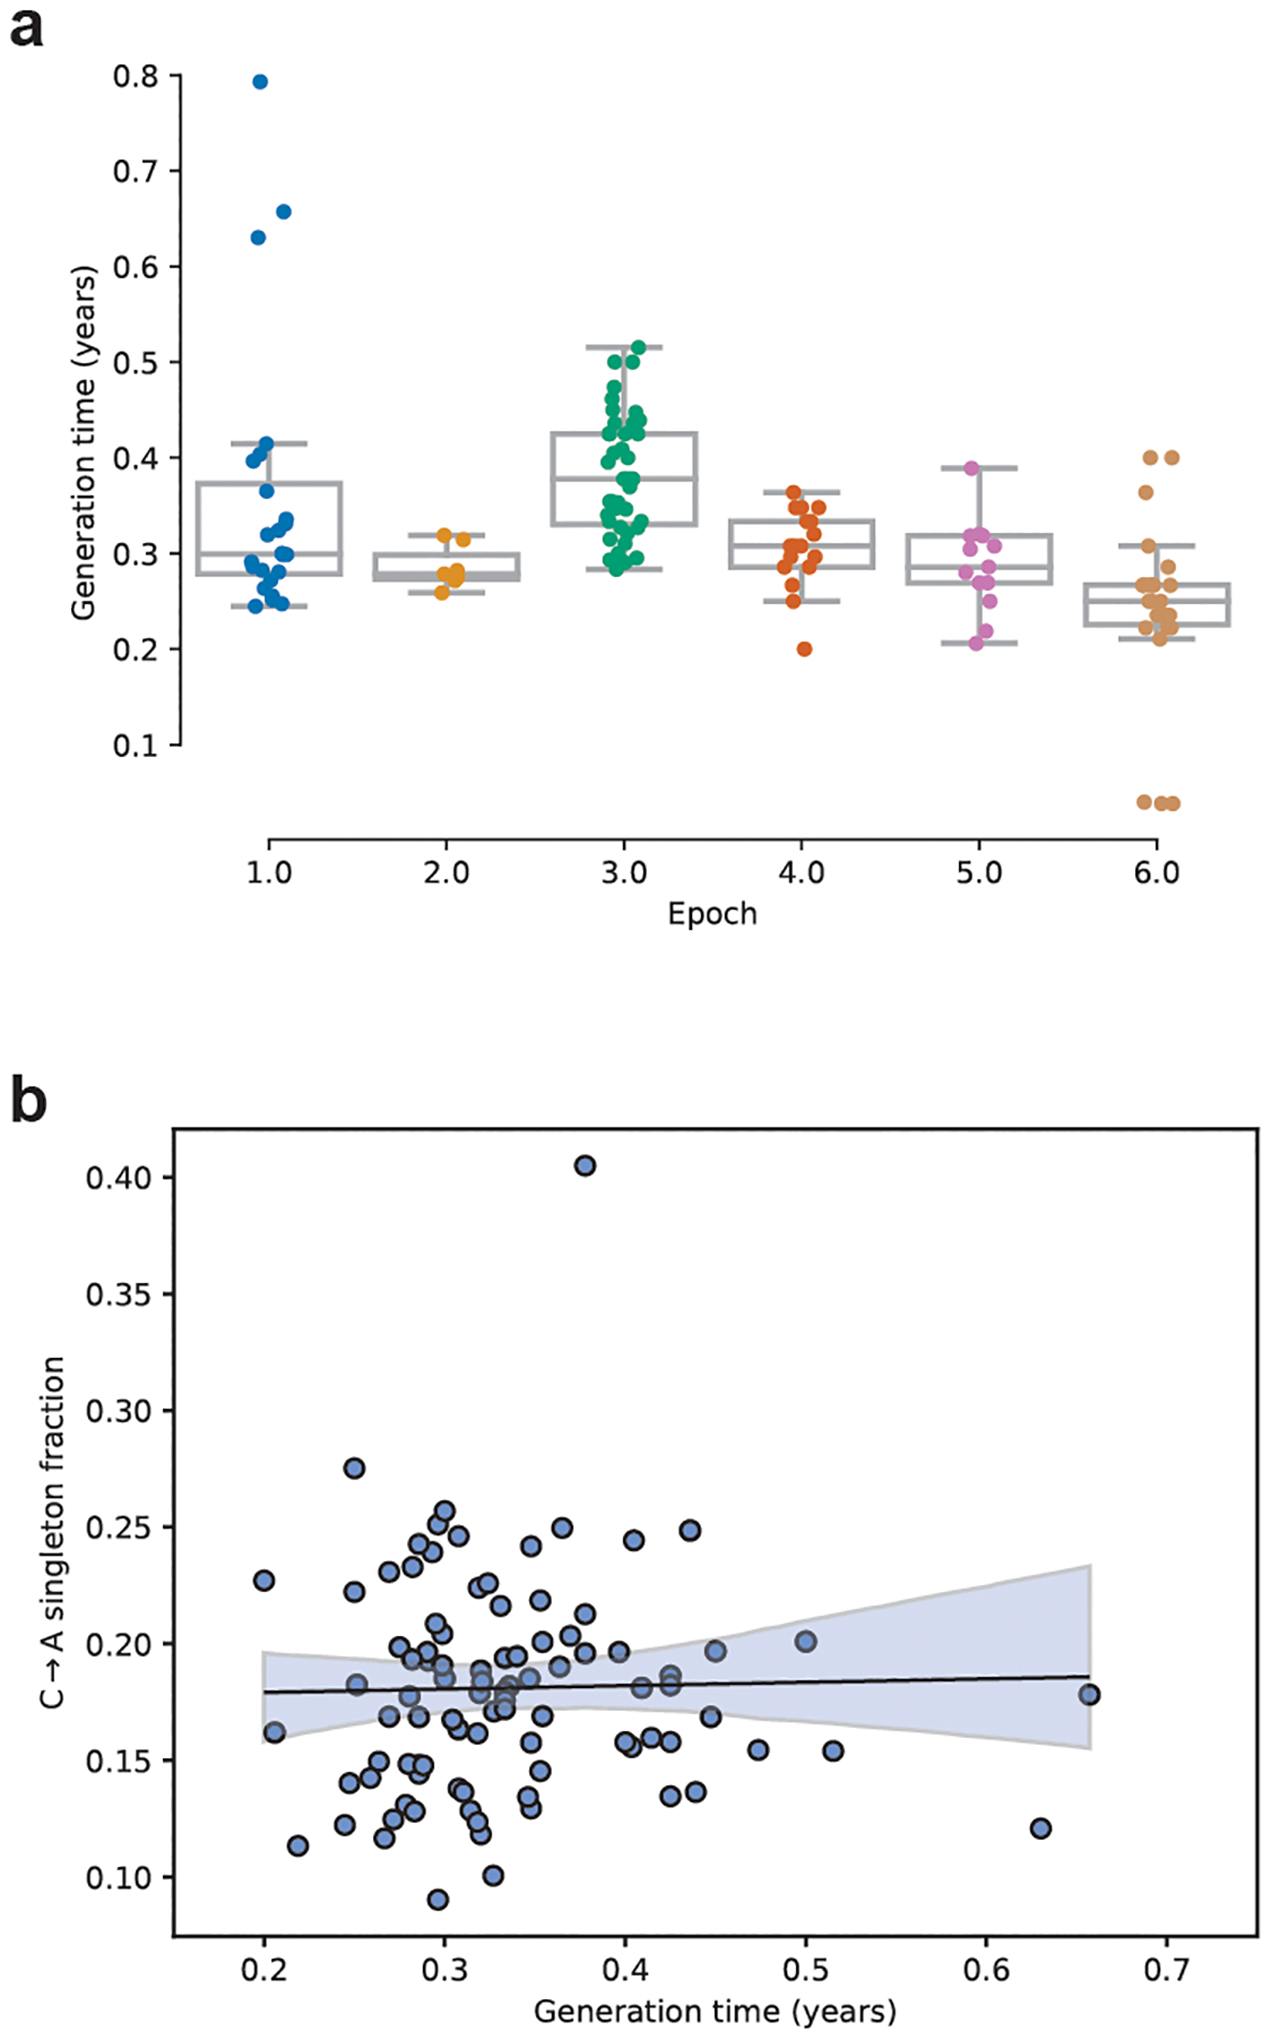
Extended Data Fig. 2 |. Generation times in the BXD lines.

a) The elapsed time since the founding of each BXD line (n = 130 biologically independent animals) was calculated by subtracting its initial breeding date from 2017. The elapsed number of years was then divided by the cumulative number of generations of inbreeding undergone by the line, to obtain an estimate of the line’s generation time in years. Boxplots are centered at the median of each distribution, with lower and upper hinges corresponding to the 25th to 75th percentiles (i.e., first and third quartiles), and whiskers extending to no further than 1.5 times the interquartile range from either hinge; data points outside of the range defined by the whiskers are displayed as individual points. b) A linear model predicting the C>A singleton fraction of each line as a function of both generation time and the line’s epoch of origin was trained using the BXD singleton mutations. C>A fraction is not significantly correlated with generation time (F = 0.055, DoF = 1, p = 0.815).
