
Figure 1. Representative cases of different JWS phenotypes with SCN5A pathogenic variants.
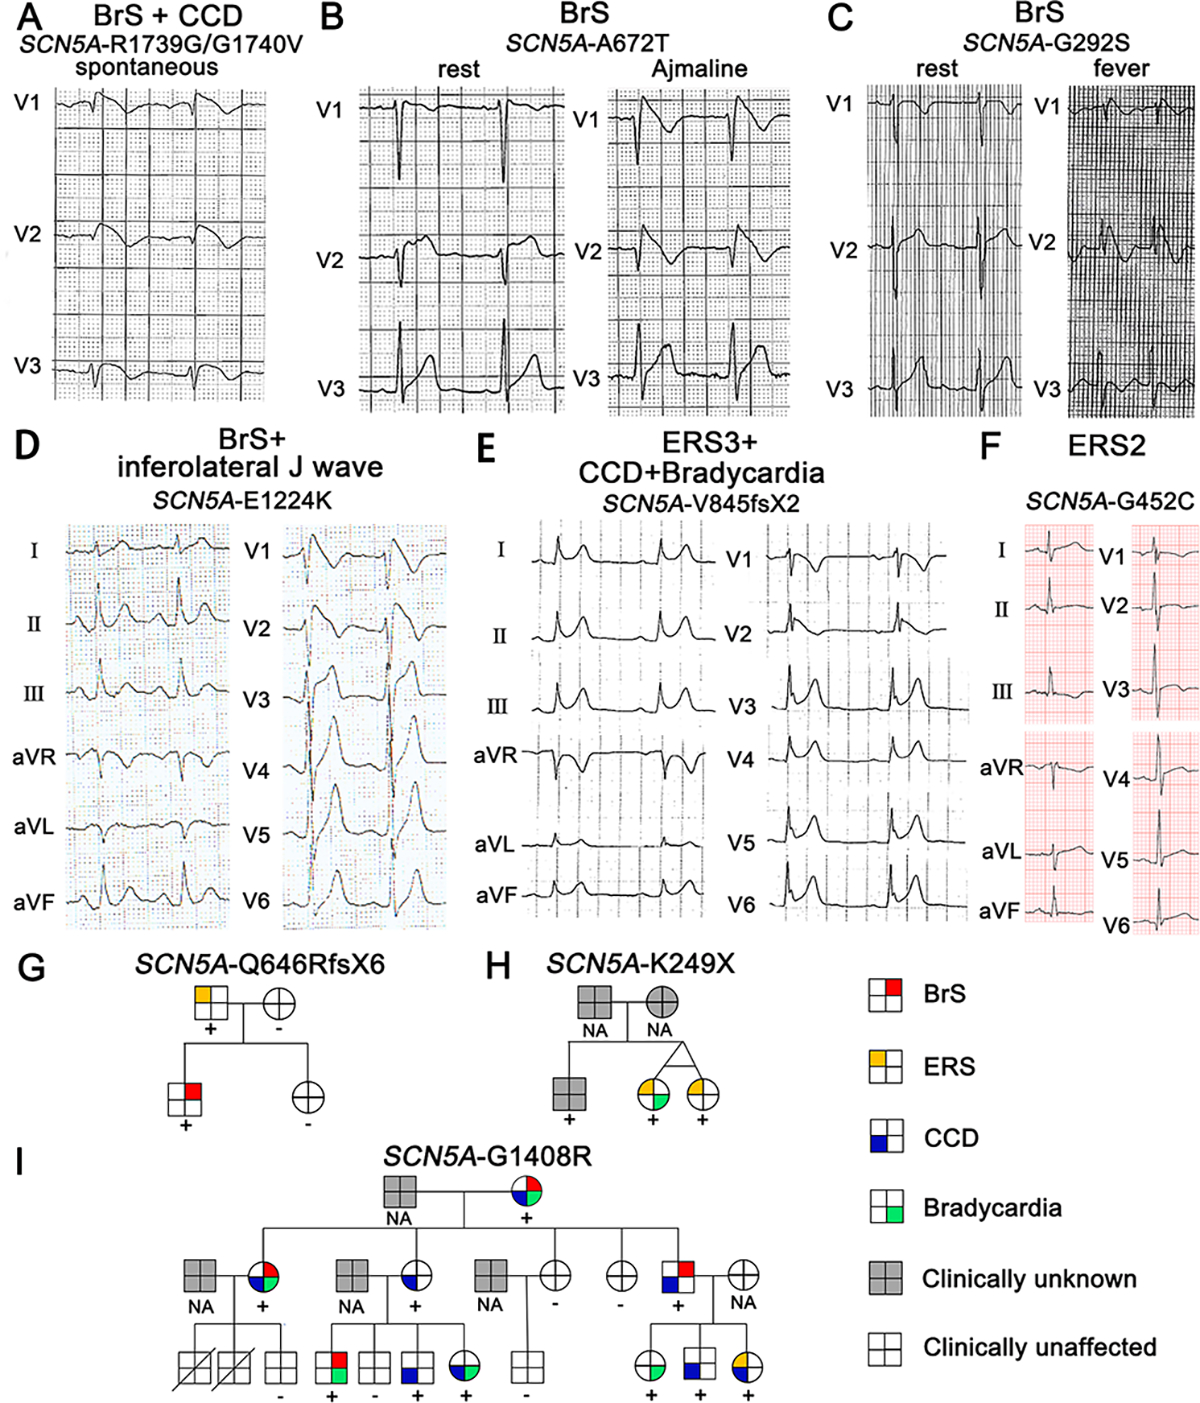
A-F: Each panel shows an ECG of different JWS phenotypes. G-I: Pedigrees of representative families with SCN5A pathogenic variants. For the pedigrees in panels G-I, male and female subjects are denoted by squares and circles; phenotypes presented by the family members are depicted by a red top right square for BrS; yellow top left square for ERS; blue bottom left square for cardiac conduction defects; green bottom right square for bradycardia; gray background for clinically unknown; blank background for clinically unaffected.