
Figure 3. Differences between BrS and ERS probands.
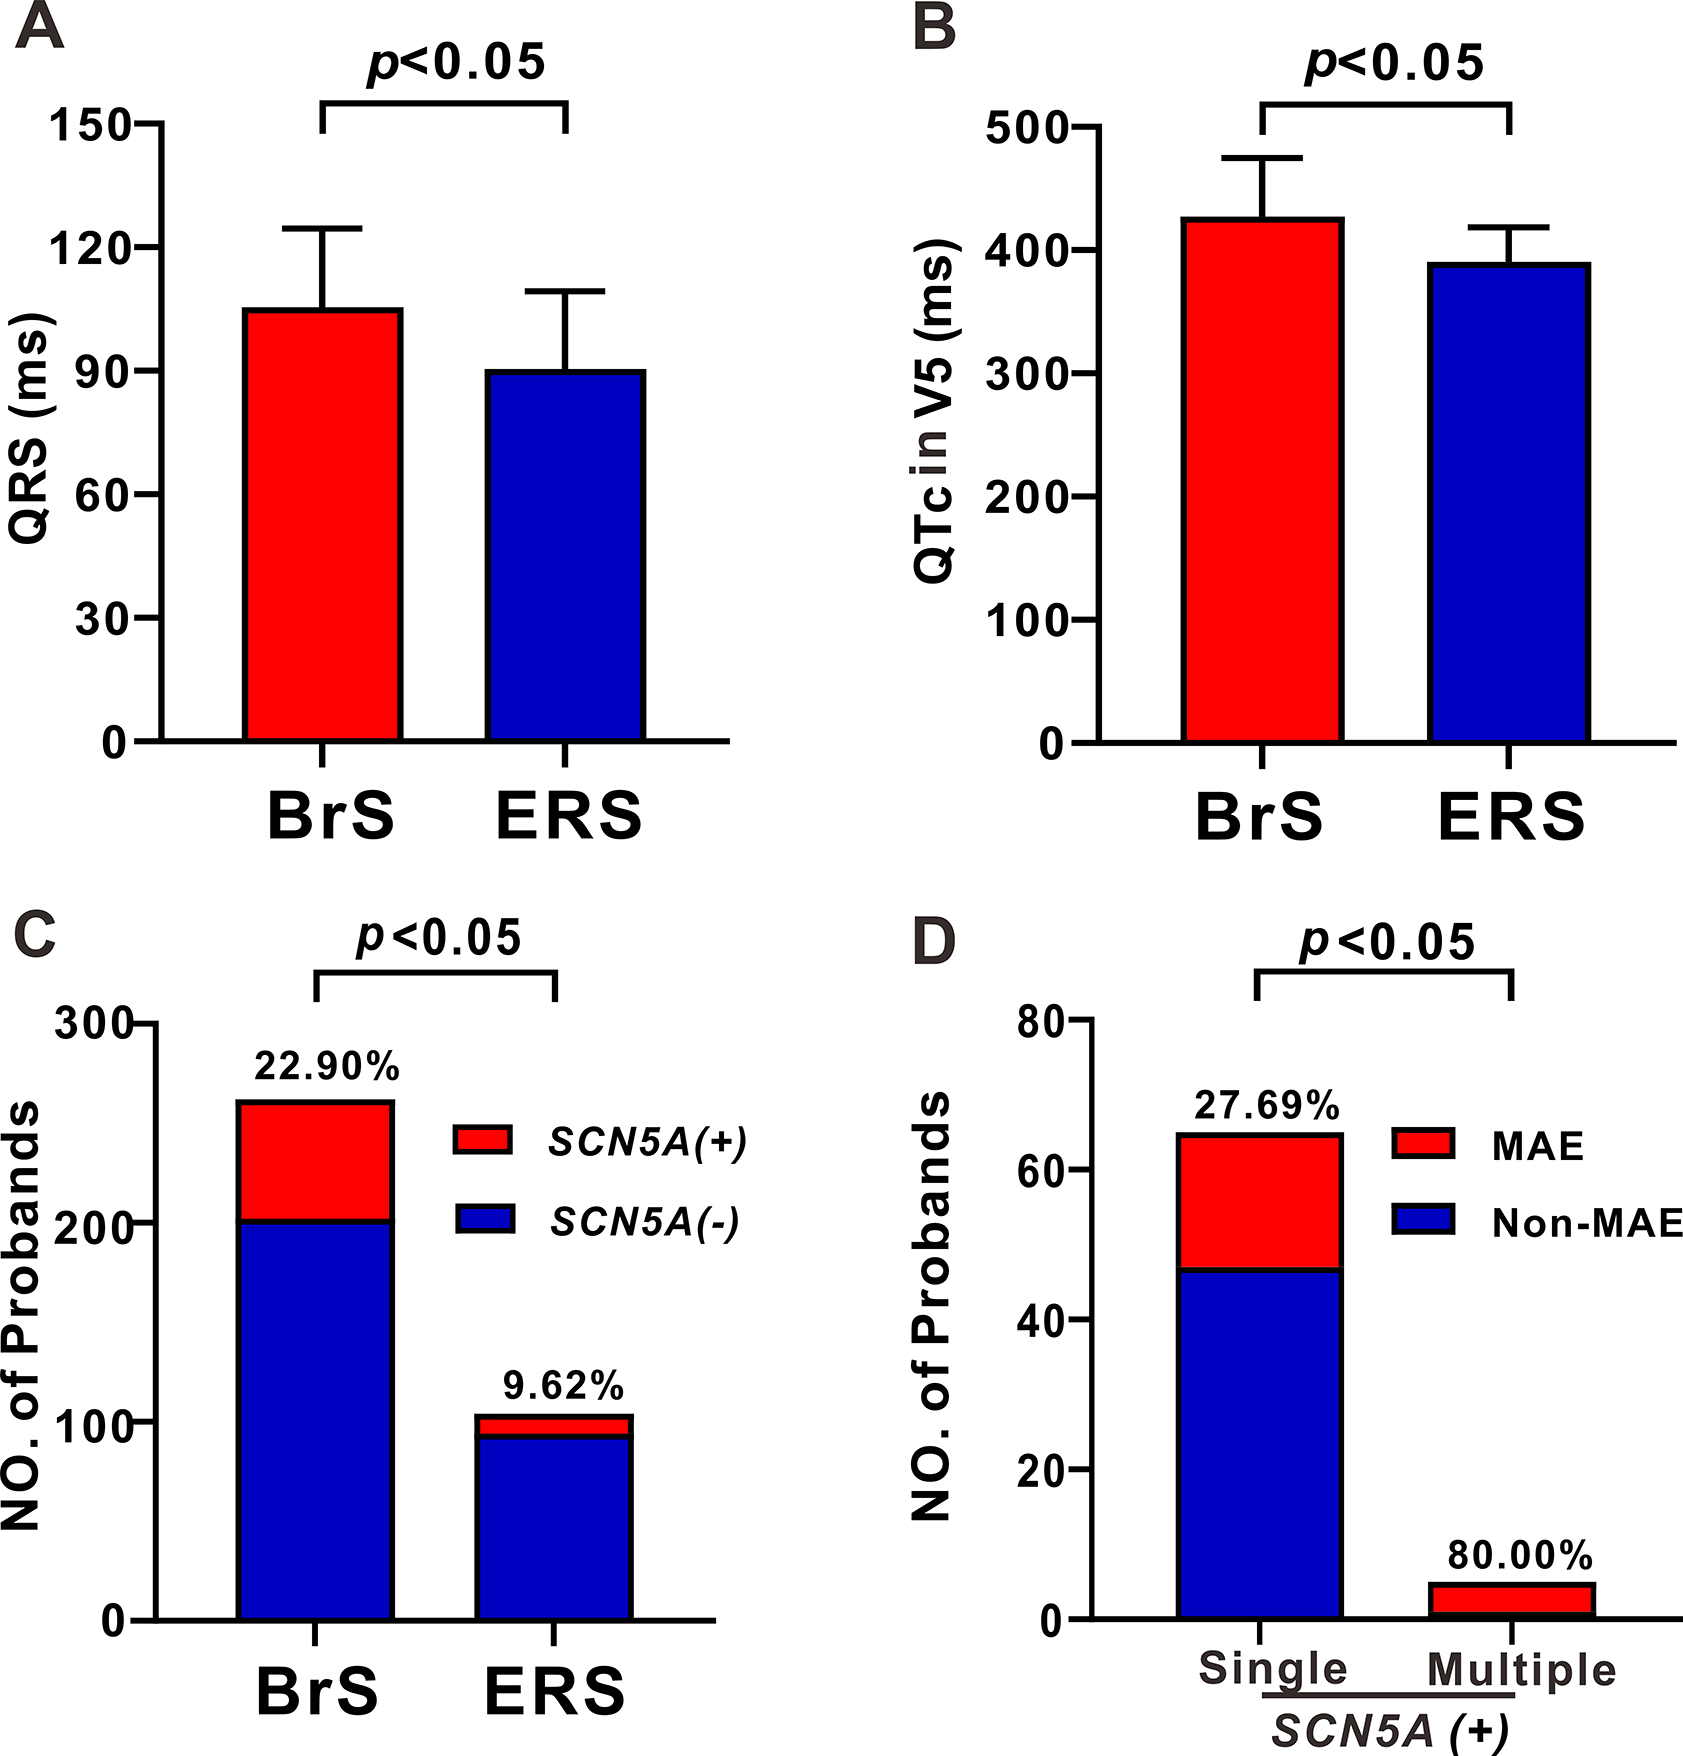
A-B: Bar graph of QRS duration (A), QTc V5 (B) between BrS and ERS probands. C: The yield of SCN5A+ pathogenic variants in BrS and ERS probands. D: The number of probands exhibiting MAE among JWS probands carrying single and multiple pathogenic variants limited to the SCN5A gene.