. 2022 Jun 28;305(2):466–476. doi: 10.1148/radiol.220492

Figure 6:

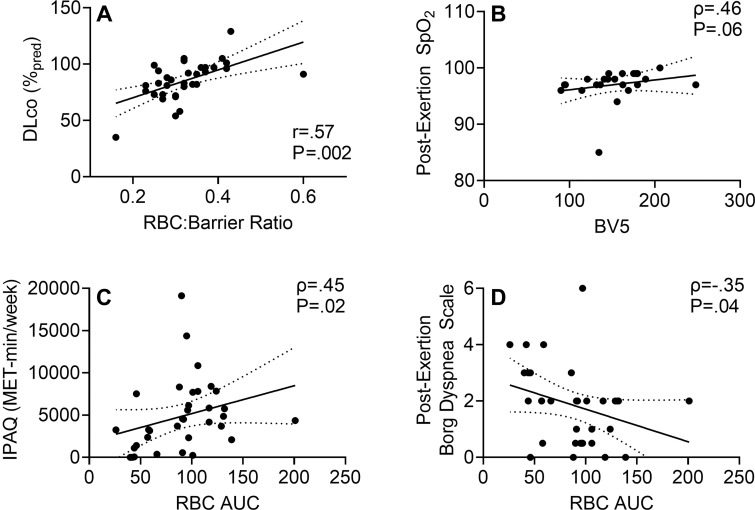
Scatterplots show xenon 129 (129Xe) MR spectroscopy measurement relationships with pulmonary function and exercise measurements in participants with post-acute COVID-19 syndrome. (A) Scatterplot shows 129Xe gas-transfer red blood cell (RBC):barrier measurements were related to (r = .57, Holm-Bonferroni P = .002) diffusing capacity of the lung for carbon monoxide (DLco). (B) Scatterplot shows 129Xe MRI RBC area under the receiver operating characteristic curve (AUC) trended toward an association with CT blood volume in vessels with cross-sectional area of 5 mm2 or smaller (BV5) (ρ = .46, Holm-Bonferroni P = .06). (C) Scatterplot shows 129Xe MR RBC AUC was related to International Physical Activity Questionnaire (IPAQ) exercise capacity (ρ = .45, Holm-Bonferroni P = .02). (D) Scatterplot shows 129Xe MR RBC AUC was related to dyspnea measured by post-exertion modified Borg Dyspnea Scale (ρ = –.35, Holm-Bonferroni P = .04). SpO2 = oxygen saturation.

Scatterplots show xenon 129 (129Xe) MR spectroscopy measurement relationships with pulmonary function and exercise measurements in participants with post-acute COVID-19 syndrome. (A) Scatterplot shows 129Xe gas-transfer red blood cell (RBC):barrier measurements were related to (r = .57, Holm-Bonferroni P = .002) diffusing capacity of the lung for carbon monoxide (DLco). (B) Scatterplot shows 129Xe MRI RBC area under the receiver operating characteristic curve (AUC) trended toward an association with CT blood volume in vessels with cross-sectional area of 5 mm2 or smaller (BV5) (ρ = .46, Holm-Bonferroni P = .06). (C) Scatterplot shows 129Xe MR RBC AUC was related to International Physical Activity Questionnaire (IPAQ) exercise capacity (ρ = .45, Holm-Bonferroni P = .02). (D) Scatterplot shows 129Xe MR RBC AUC was related to dyspnea measured by post-exertion modified Borg Dyspnea Scale (ρ = –.35, Holm-Bonferroni P = .04). SpO2 = oxygen saturation.