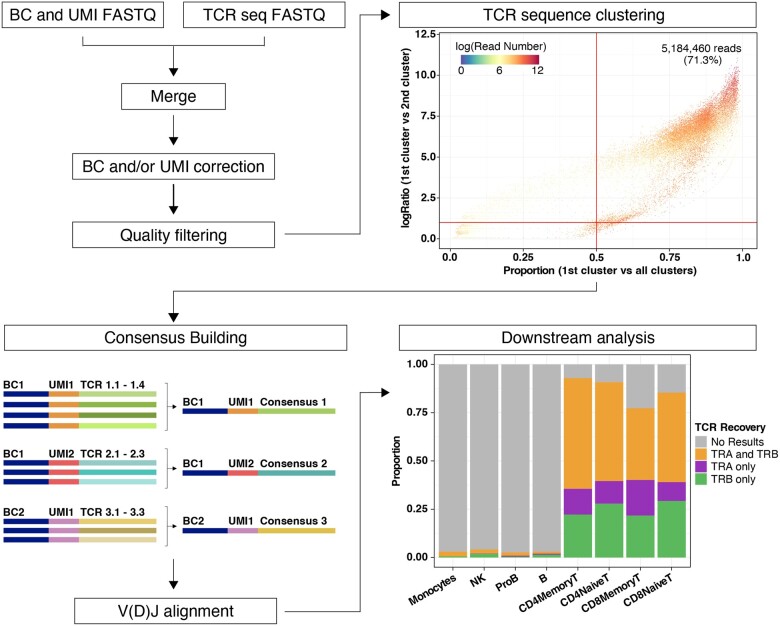
Fig. 1.
Overview of WAT3R. The workflow starts by merging two FASTQ files, correction of cell barcodes and UMIs and quality filtering (top left). Clustering of TCR sequences with identical barcode and UMI is then performed. Top right dot plot shows evaluation of cluster quality by comparing the proportion of reads supporting the most abundant cluster (x-axis), the ratio of the most abundant cluster to the second (y-axis) and the number of reads supporting each TCR sequence with a specific barcode and UMI (color). Bottom left: TCR consensus sequences are generated and used for V(D)J alignment. In downstream analysis, results are integrated with a paired scRNA-seq dataset. Bottom right bar plot shows the proportion of cells in the dataset, separated by cell type, for which WAT3R returned information on the TRA gene, TRB gene or both. (A color version of this figure appears in the online version of this article.)

