
Figure 1.
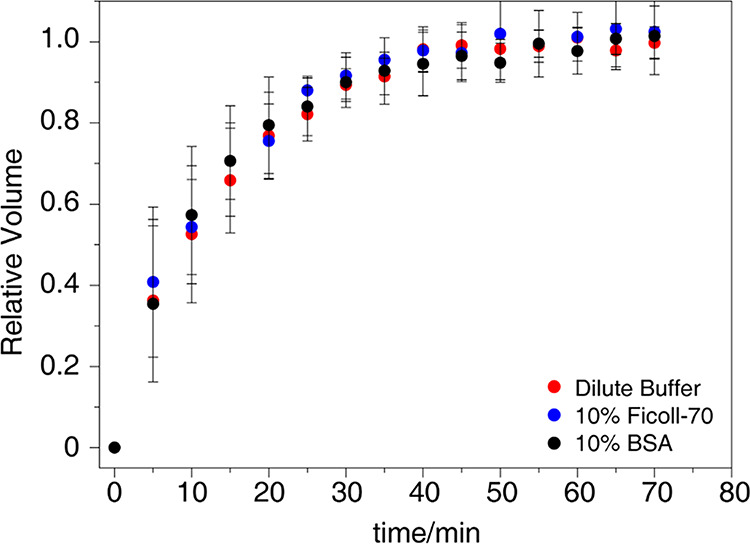
The averaged relative volume ratios of the amide cross-peaks of T9, G13, L14, V61, and T62 are plotted against the duration of the phosphoryl transfer in the dilute buffer (red dots), 10% Ficoll-70 (blue dots), and 10% BSA (black dots). The error bars show the standard deviations.