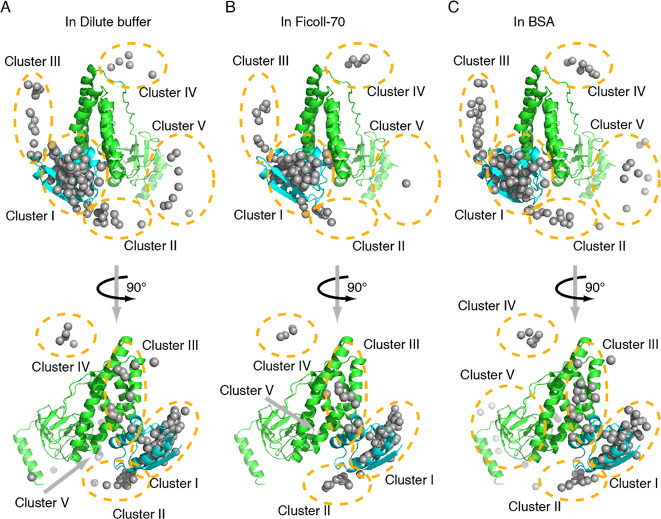
Figure 5.
Calculated ensemble structures of the EIN-HPr complex in dilute buffer (A), Ficoll-70 (B), and BSA (C). The specific complex of EIN (green) and HPr (cyan) are shown as cartoon, and the mass center of HPr molecules of the calculated EIN-HPr complex is shown as gray dots. According to the location on the EIN surface, HPr molecules are divided into five clusters marked using dashed cycles or noted as arrows.

