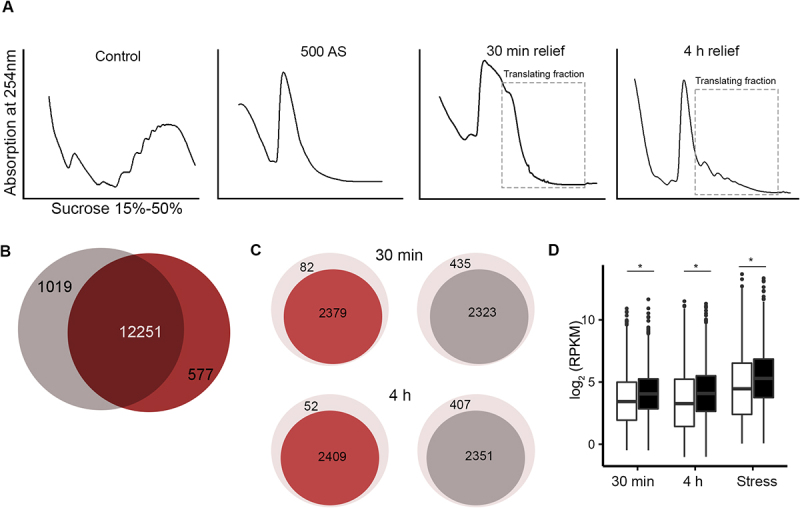
Figure 2.

Nearly all mRNAs deposited in SGs are translated upon stress relief. (A) Translation profiles using sucrose gradients of HEK-TIA1 cells following stress recovery. Cells were pre-exposed for 30 min to stress (500 µM AS) and samples were collected at 30 min and 4 h of stress relief (i.e. after medium exchange and AS removal). Control denotes cells grown under permissive conditions and not being exposed to stress. Translating mRNA fractions, which were collected for RNA-seq, are designated. (B) Total number of unique mRNAs identified as translating (i.e. in the polysomes) at 30 min (grey) and 4 h (red) following stress relief. (C) Translating mRNAs at the two time points following stress relief (darker colours) whose identities overlap with m6A-modified mRNAs in SGs (red) and non-methylated mRNAs in SGs (grey) (D) Boxplot of the abundance (RPKM) of translating mRNAs. mRNAs are separated by their modification status in the SGs, i.e. m6A-modified (black) and non-methylated (white). Stress denotes expression of mRNAs isolated from cells exposed 500 µM AS for 30 min, and grouped based on their methylation status in SGs. p = 4.82x10⁻²², p = 1.17x10⁻²⁷ and 2.07 × 10⁻²⁵ Mann–Whitney test between methylated and non-methylated mRNAs at 30 min, 4 h and total mRNA, respectively. Note that for cells exposed to stress total mRNAs was analysed, hence, the higher expression levels than in cells after stress relief in which only the polysome-bound mRNAs were considered.
