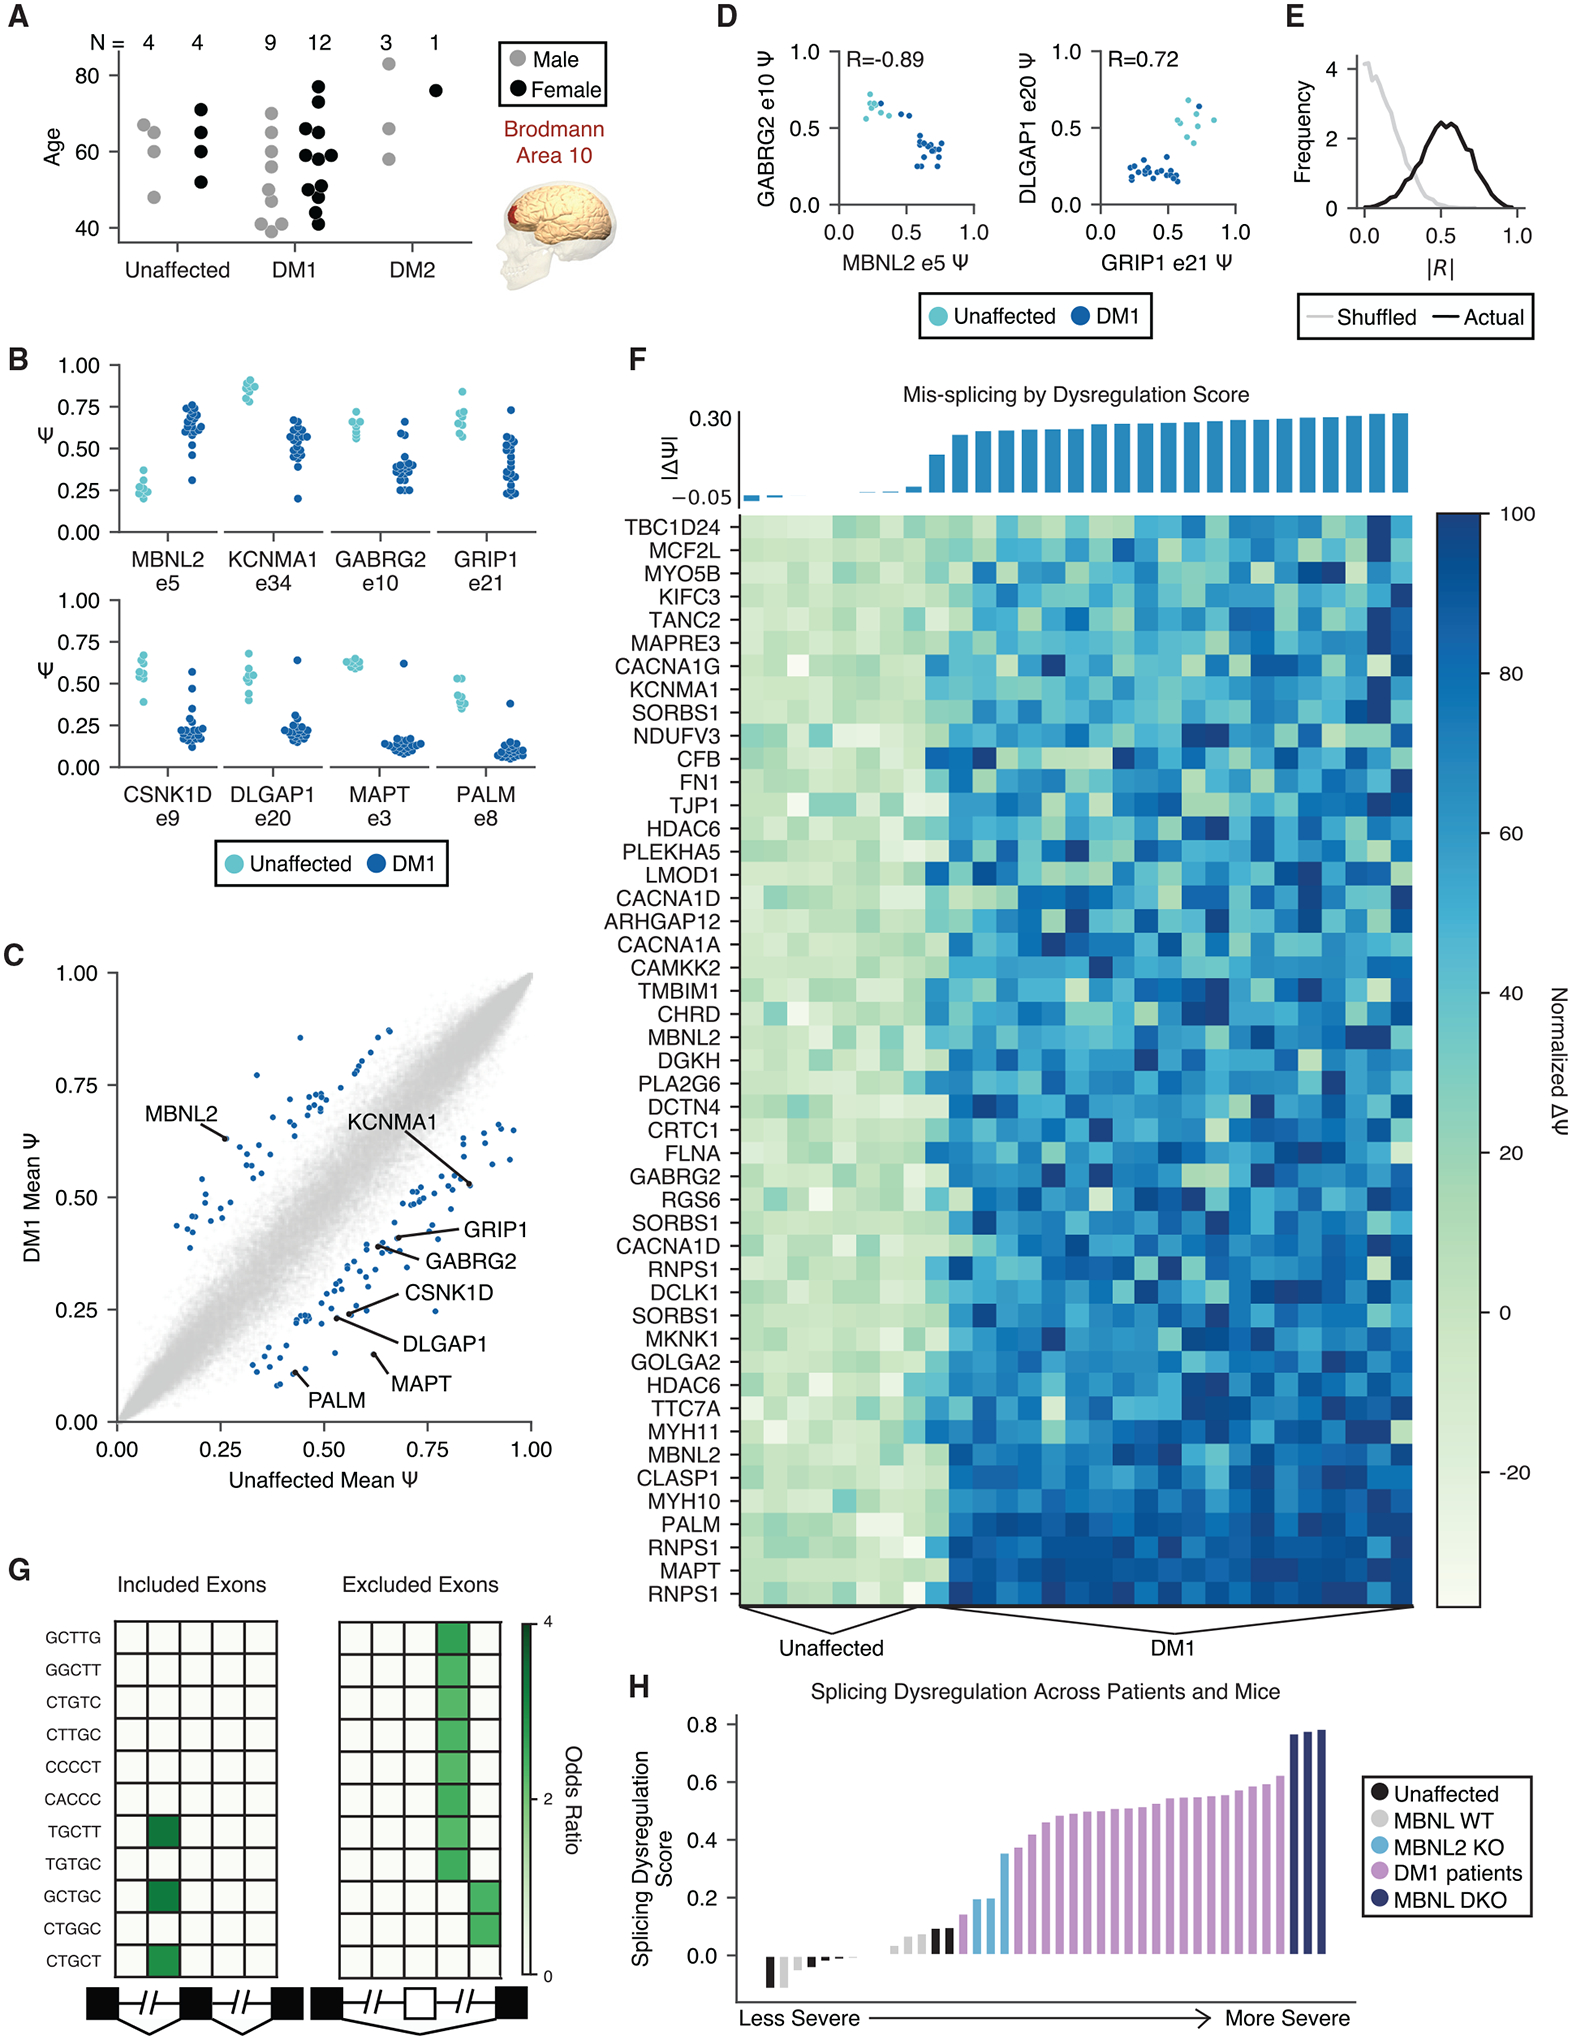
Figure 1. Mis-splicing changes across DM1 FC samples show a gradient of severity consistent with quantitative loss of MBNL.

(A) RNA-seq was performed on 21 DM1, 4 DM2, and 8 unaffected FC (Brodmann area 10) samples across a range of ages.
(B) Percentage spliced in (PSI, ψ) for specific exons in unaffected and DM1 FC samples.
(C) Scatterplot of mean ψ for unaffected versus DM1 samples for all exons measured; 130 mis-splicing events were detected as significantly regulated (|Δψ| > 0.2, p < 0.01 by rank-sum test) and are highlighted in blue.
(D) Scatterplot of ψ for MBNL2 exon 5 versus GABRG2 exon 10 and GRIP1 exon 21 versus DLGAP1 exon 20 across unaffected and DM1 individuals. The Pearson correlation value is shown.
(E) Histogram of correlation values for all pairs of 130 significantly regulated exons (black). A similar histogram of correlation values for all pairs following shuffling of patient identities is also shown (gray) (see STAR Methods). A Kolmogorov-Smirnov (KS) test shows that the distributions are different (p < 1e–300).
(F) Normalized ψ for 47 of the 130 significantly regulated exons showing the least variation in ψ across unaffected FC (see STAR Methods). Individuals are sorted by splicing dysregulation score (see STAR Methods), also shown above in bars.
(G) Heatmap showing enrichment of motifs around the 101 significantly regulated skipped exons relative to all other measured skipped exons. The columns denote the intronic region from +1 to +250 and −250 to −1 of the upstream intron, the skipped exon, and the intronic region from +1 to +250 and −250 to −1 of the downstream intron.
(H) Total splicing dysregulation in all human and MBNL KO mouse samples considered as computed using 74 orthologous exons significantly dysregulated (|Δψ| > 0.1, p < 0.05 by rank-sum test) in DM1 patients and MBNL DKO mice.
