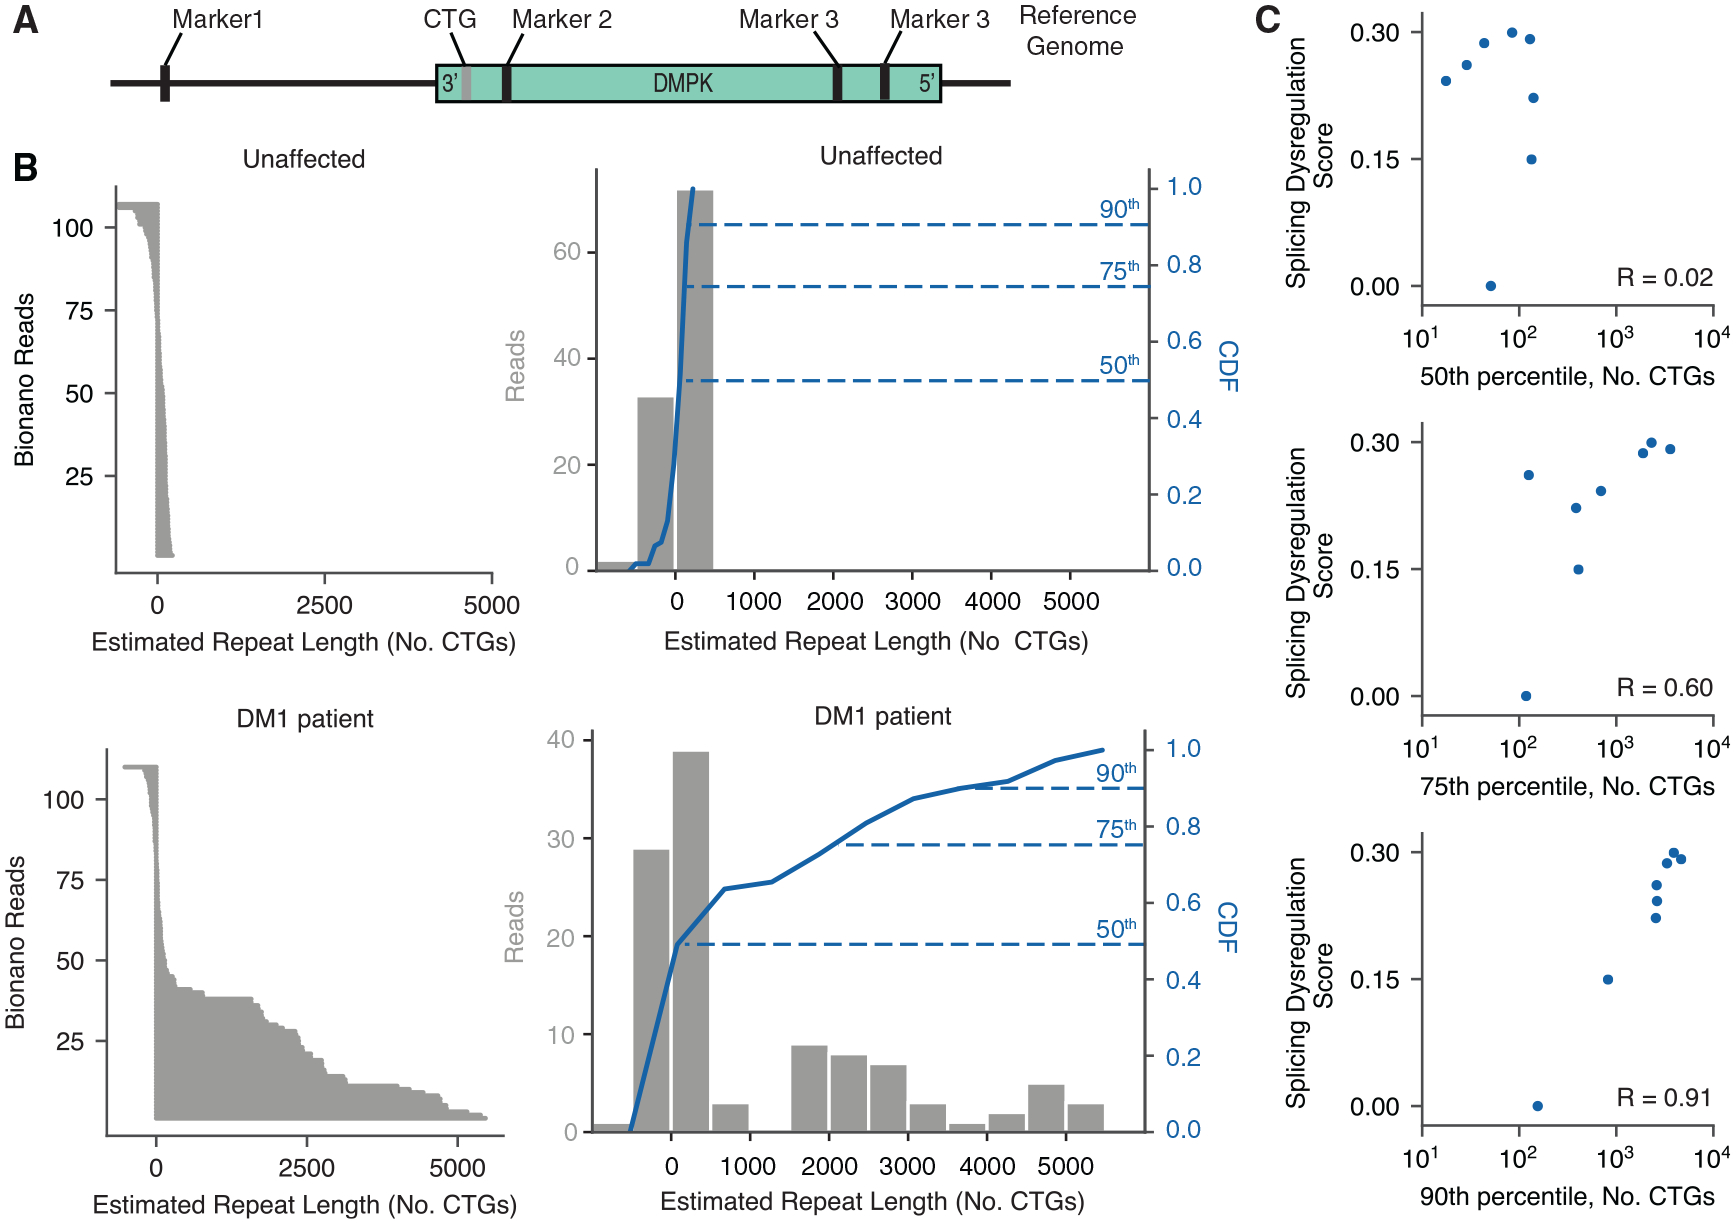
Figure 2. DM1 FC samples show large expansions, and the proportion of long expansions correlates with overall splicing dysregulation.

(A) DNA fragments from unaffected and DM1 FC samples were labeled by direct labeling enzyme (DLE) and subjected to optical mapping of the DMPK locus.
(B) Observed Bionano reads are shown on the left for one unaffected individual (top) and one DM1 individual (bottom). Histograms of the estimated CTG repeat lengths are shown on the right (gray bars) for individuals, along with their cumulative distribution functions (CDFs, blue line). The 50th, 75th, and 90th percentiles of repeat lengths are indicated.
(C) Scatterplot of the 50th, 75th, and 90th percentiles of repeat lengths versus total splicing dysregulation across all unaffected and DM1 individuals for which repeat lengths were measured. Pearson correlation values are shown.
