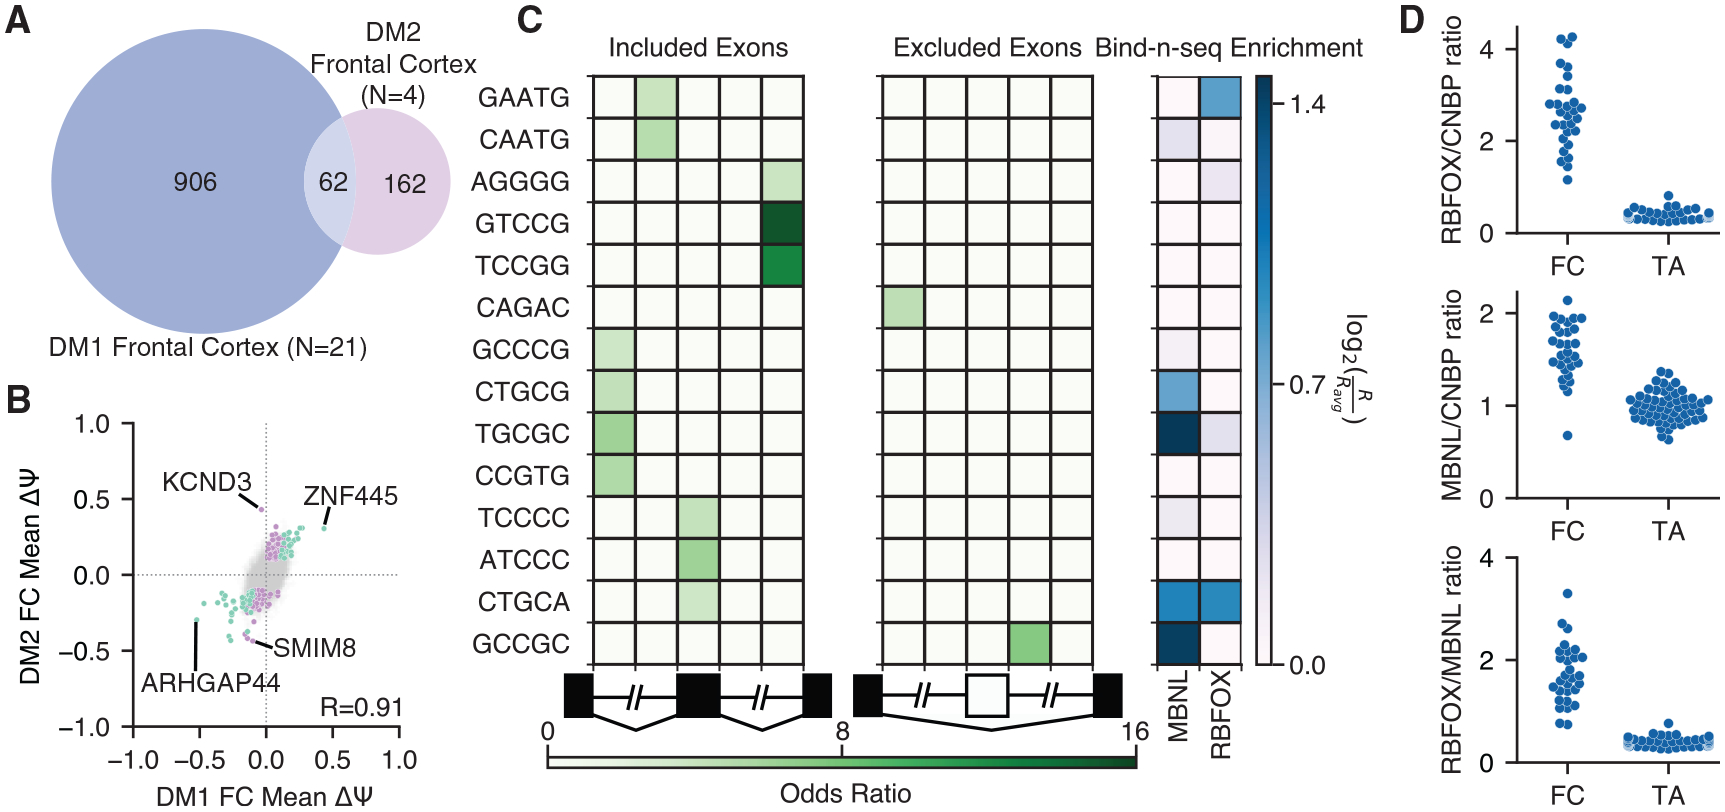
Figure 5. The extent of mis-splicing shared between DM1 and DM2 FC is limited.

(A) Venn diagram showing exons mis-spliced (|Δψ| > 0.1, p < 0.01 by rank-sum test) in DM1 or DM2 FC or both.
(B) Scatterplot of Δψ for DM2 versus DM1. 62 exons identified to be significantly regulated in both DM1 and DM2 (|Δψ| > 0.1, p < 0.01 by rank-sum test) are highlighted in teal, and 162 exons identified to be significantly regulated uniquely in DM2 (|Δψ| > 0.1, p < 0.01 by rank-sum test) are highlighted in purple. DM1-specific events have been omitted for clarity. Pearson correlation for shared (teal) events is shown.
(C) Heatmap showing enrichment of motifs around 35 DM2-regulated skipped exons relative to all other measured skipped exons. The columns denote the intronic region from +1 to +250 and −250 to −1 of the upstream intron, the skipped exon, and the intronic region +1 to +250 and −250 to −1 of the downstream intron. Bind-N-Seq enrichment values for MBNL and RBFOX are also shown; enrichments were derived from experiments using 1,080 nM MBNL1 or 1,100 nM RBFOX2.
(D) Transcript per million (TPM) ratios of total RBFOX (RBFOX1, RBFOX2, and RBFOX3) versus CNBP, total MBNL (MBNL1, MBNL2, and MBNL3) versus CNBP, and total RBFOX versus total MBNL are shown across FC and skeletal muscle. Note the high concentration of RBFOX in FC relative to skeletal muscle.
