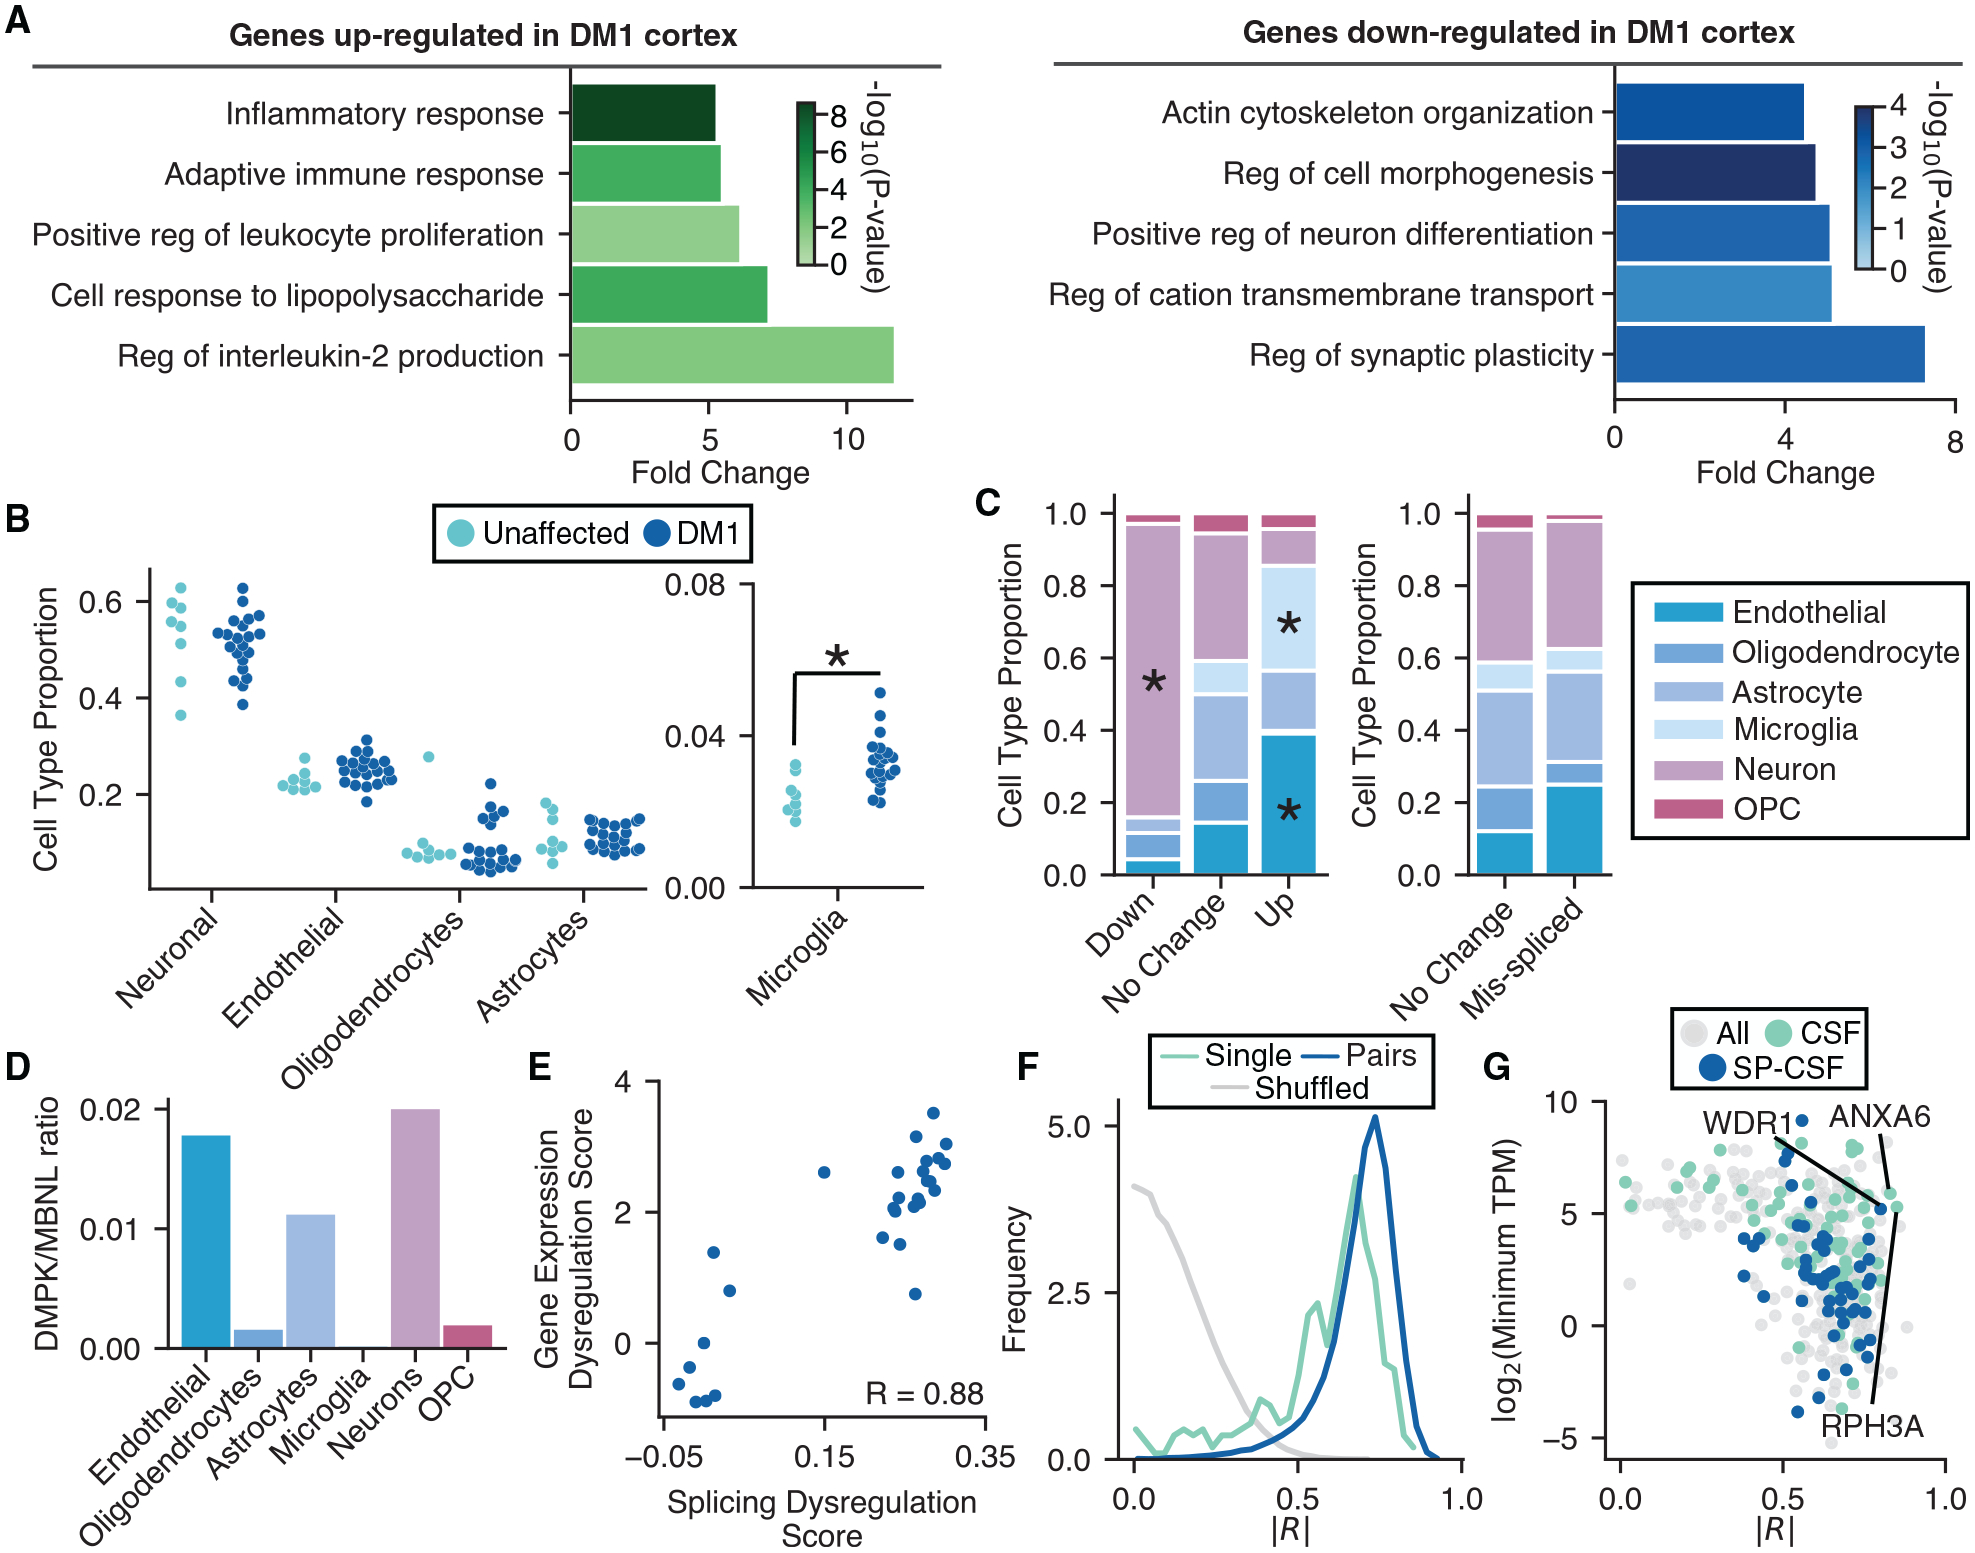
Figure 6. Analysis of gene expression changes reveals neuroinflammation and potential biomarkers.

(A) Gene Ontology analysis of genes upregulated (green) and downregulated (blue) in DM1 versus unaffected FC (top five categories shown for each, selected by fold change).
(B) Proportions of neurons, microglia, endothelial cells, oligodendrocytes, and astrocytes in each FC sample were estimated by Bayesian inference using published transcriptome profiles (see STAR Methods) and plotted. Significance is shown by an asterisk.
(C) Proportion of up-, non-, and downregulated genes derived from specific cell types is shown (left panel). The proportion of mis-spliced and unaffected genes derived from specific cell types is also shown (right panel). Cell-type specificity for genes was determined using publicly available single-cell sequencing data (see STAR Methods). Significance is shown by an asterisk.
(D) TPM ratios for DMPK versus total MBNL (MBNL1, MBNL2, and MBNL3) across various CNS cell types.
(E) Scatterplot of splicing dysregulation score versus gene expression dysregulation score (see STAR Methods). Pearson correlation is shown (p = 3e–10).
(F) Pearson correlations between splicing dysregulation score and log2(TPM) for each dysregulated gene were computed and plotted as a histogram (teal). Samples were shuffled and correlations were recomputed and plotted (gray). A similar score was also computed between splicing dysregulation and all pairs of genes (blue) (see STAR Methods). Absolute values for all correlations were used for plotting. Similarities of distributions were assessed by a KS test; p < 1e–300 when comparing shuffled to single genes, and p < −200 when comparing shuffled to pairs of genes.
(G) Scatterplot of the single-gene correlations computed in (F) versus log2(TPM) for those genes. Genes encoding proteins detectable in CSF, and those additionally found to have signal sequences (SignalP) (see STAR Methods) are highlighted in teal and blue, respectively.
