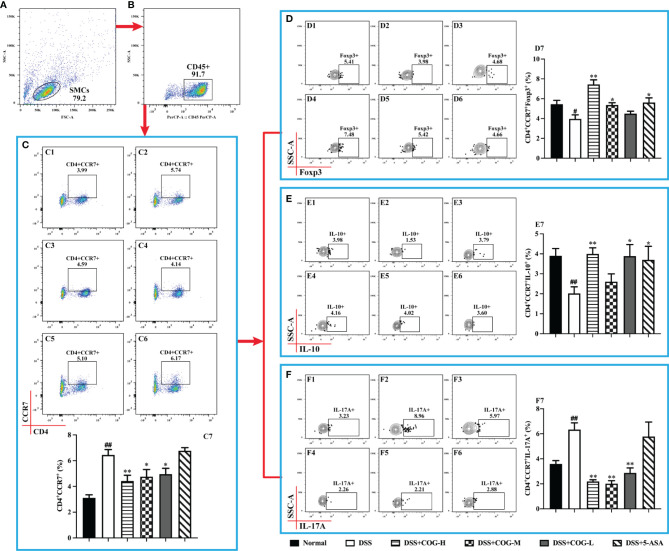
Figure 6.
COG regulated CCR7+CD4+ T cells in mice with colitis. (A) Spleen mononuclear cells (SMCs). (B) CD45+ cells. (C) Flow cytometry analysis of CCR7+ memory T cells: C1–C6 represent CCR7+ memory T cells in the normal, DSS, DSS+COG-H, DSS+COG-M, DSS+COG-L, and DSS+5-ASA groups, respectively; C7: statistical analysis of CCR7+ memory T-cell frequencies in these six groups. (D) Flow cytometry analysis of Foxp3+CCR7+ memory T cells: D1–D6 represent Foxp3+CCR7+ memory T cells in the normal, DSS, DSS+COG-H, DSS+COG-M, DSS+COG-L, and DSS+5-ASA groups, respectively; D7: statistical analysis of Foxp3+CCR7+ memory T-cell frequencies in these six groups. (E) Flow cytometry analysis of IL-10+CCR7+ memory T cells: E1–E6 represent IL-10+CCR7+ memory T cells in the normal, DSS, DSS+COG-H, DSS+COG-M, DSS+COG-L, and DSS+5-ASA groups, respectively; E7: statistical analysis of Foxp3+CCR7+ memory T-cell frequencies in these six groups. (F) Flow cytometry analysis of IL-17A+CCR7+ memory T cells: F1–F6 represent IL-17A+CCR7+ memory T cells in the normal, DSS, DSS+COG-H, DSS+COG-M, DSS+COG-L, and DSS+5-ASA groups, respectively; F7: statistical analysis of IL-17A+CCR7+ memory T-cell frequencies in these six groups. Data were presented as mean ± SEM (n = 8–12). #p < 0.05 and ##p < 0.01 compared to the normal group; *p < 0.05 and **p < 0.01 compared to the DSS group.

