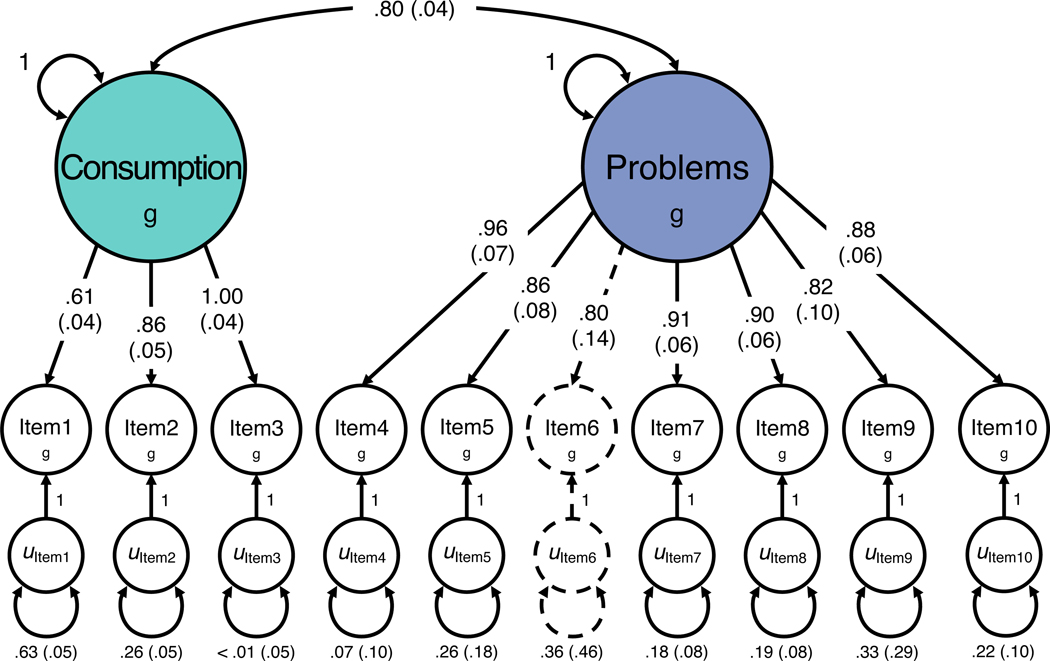
Figure 1.
Genetic relationships between AUDIT items. Path diagram of the best fitting genetic confirmatory factor model for AUDIT, as estimated with Genomic Structural Equation Modeling. All parameter estimates are standardized, and standard errors are presented in parentheses. The genetic components of items and factors (denoted by g) are inferred variables that are represented as circles. Regression relationships between variables are represented as straight one-headed arrows pointing from the independent variable(s) to the dependent variable(s). Covariance relationships are depicted as curved two-headed arrows linking two variables. The variances for factors are represented as a two-headed arrow connecting the variable to itself, as are the residual variances for individual items (denoted by u). As item 6 was included via factor extension, its parameter estimates are illustrated using dashed lines.

