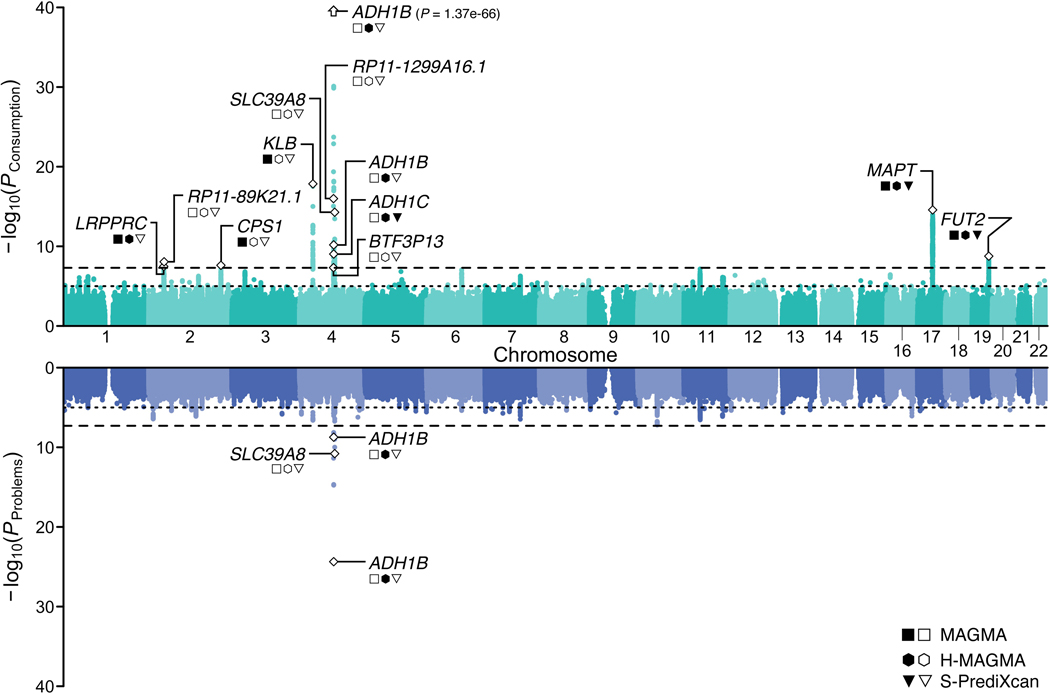
Figure 3.
Multivariate genome-wide association analyses for the latent genetic factors. Miami plot for the two latent genetic factors: Consumption (top) and Problems (bottom). Approximately independent lead SNPs are labeled with a white diamond. For each lead SNP, the neared gene is labeled. Additional symbols convey findings from additional biological annotation; filled symbols indicate that the gene was identified in the corresponding pipeline, while empty symbols indicate that the gene was not. The y-axis refers to the significance on a -log10 scale, the x-axis refers to chromosomal position, the horizontal dotted line marks suggestive significance (p = 1E-5), and the horizontal dashed line denotes genome-wide significance (p = 5E-8).

