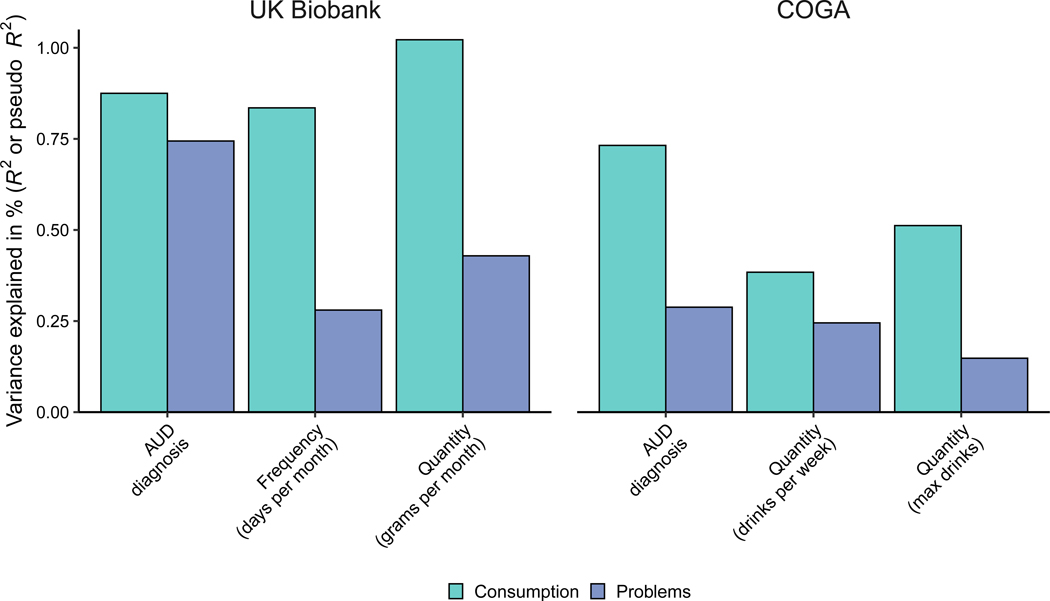
Figure 4.
Associations between Consumption and Problems PRS and selected alcohol-related phenotypes. Bar charts of the variance explained by Consumption and Problems PRS for various clinical and quantitative measures of alcohol use. Values correspond to the proportion of variance explained the outcome (R2 or pseudo R2 depending on the use of linear or logistic regression; see Supplementary Section 7 for more details). Results for the independent UK Biobank subsample are presented on the left, while results for the independent COGA cohort are presented on the right. Please note that the COGA models are not directly comparable to those from the UKB models, as mixed-effect models were used in COGA. Please also note that the R2 for each PRS is calculated from a single PRS model and, as such, the values not independent (due to shared variance between PRSs). Complete results are available in Tables S32–S35.

