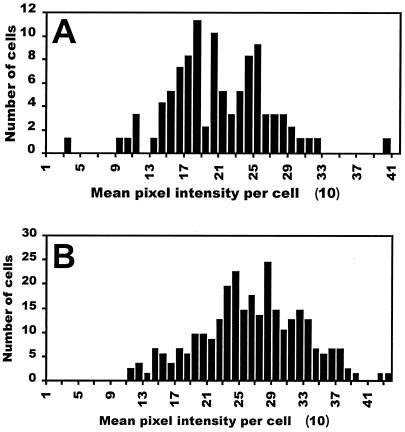
FIG. 7.
Histograms of the distribution of the mean pixel intensity per cell of E. herbicola 299R(pKT-bla) cells containing a Pbla-gfp transcriptional fusion and grown in MCA supplemented with 58 μM (A) and 29 mM (B) sucrose. The Kolmogorov-Smirnov statistics for these two distributions are D = 0.064 and P = 0.43 (A) and D = 0.035 and P = 0.52 (B).

