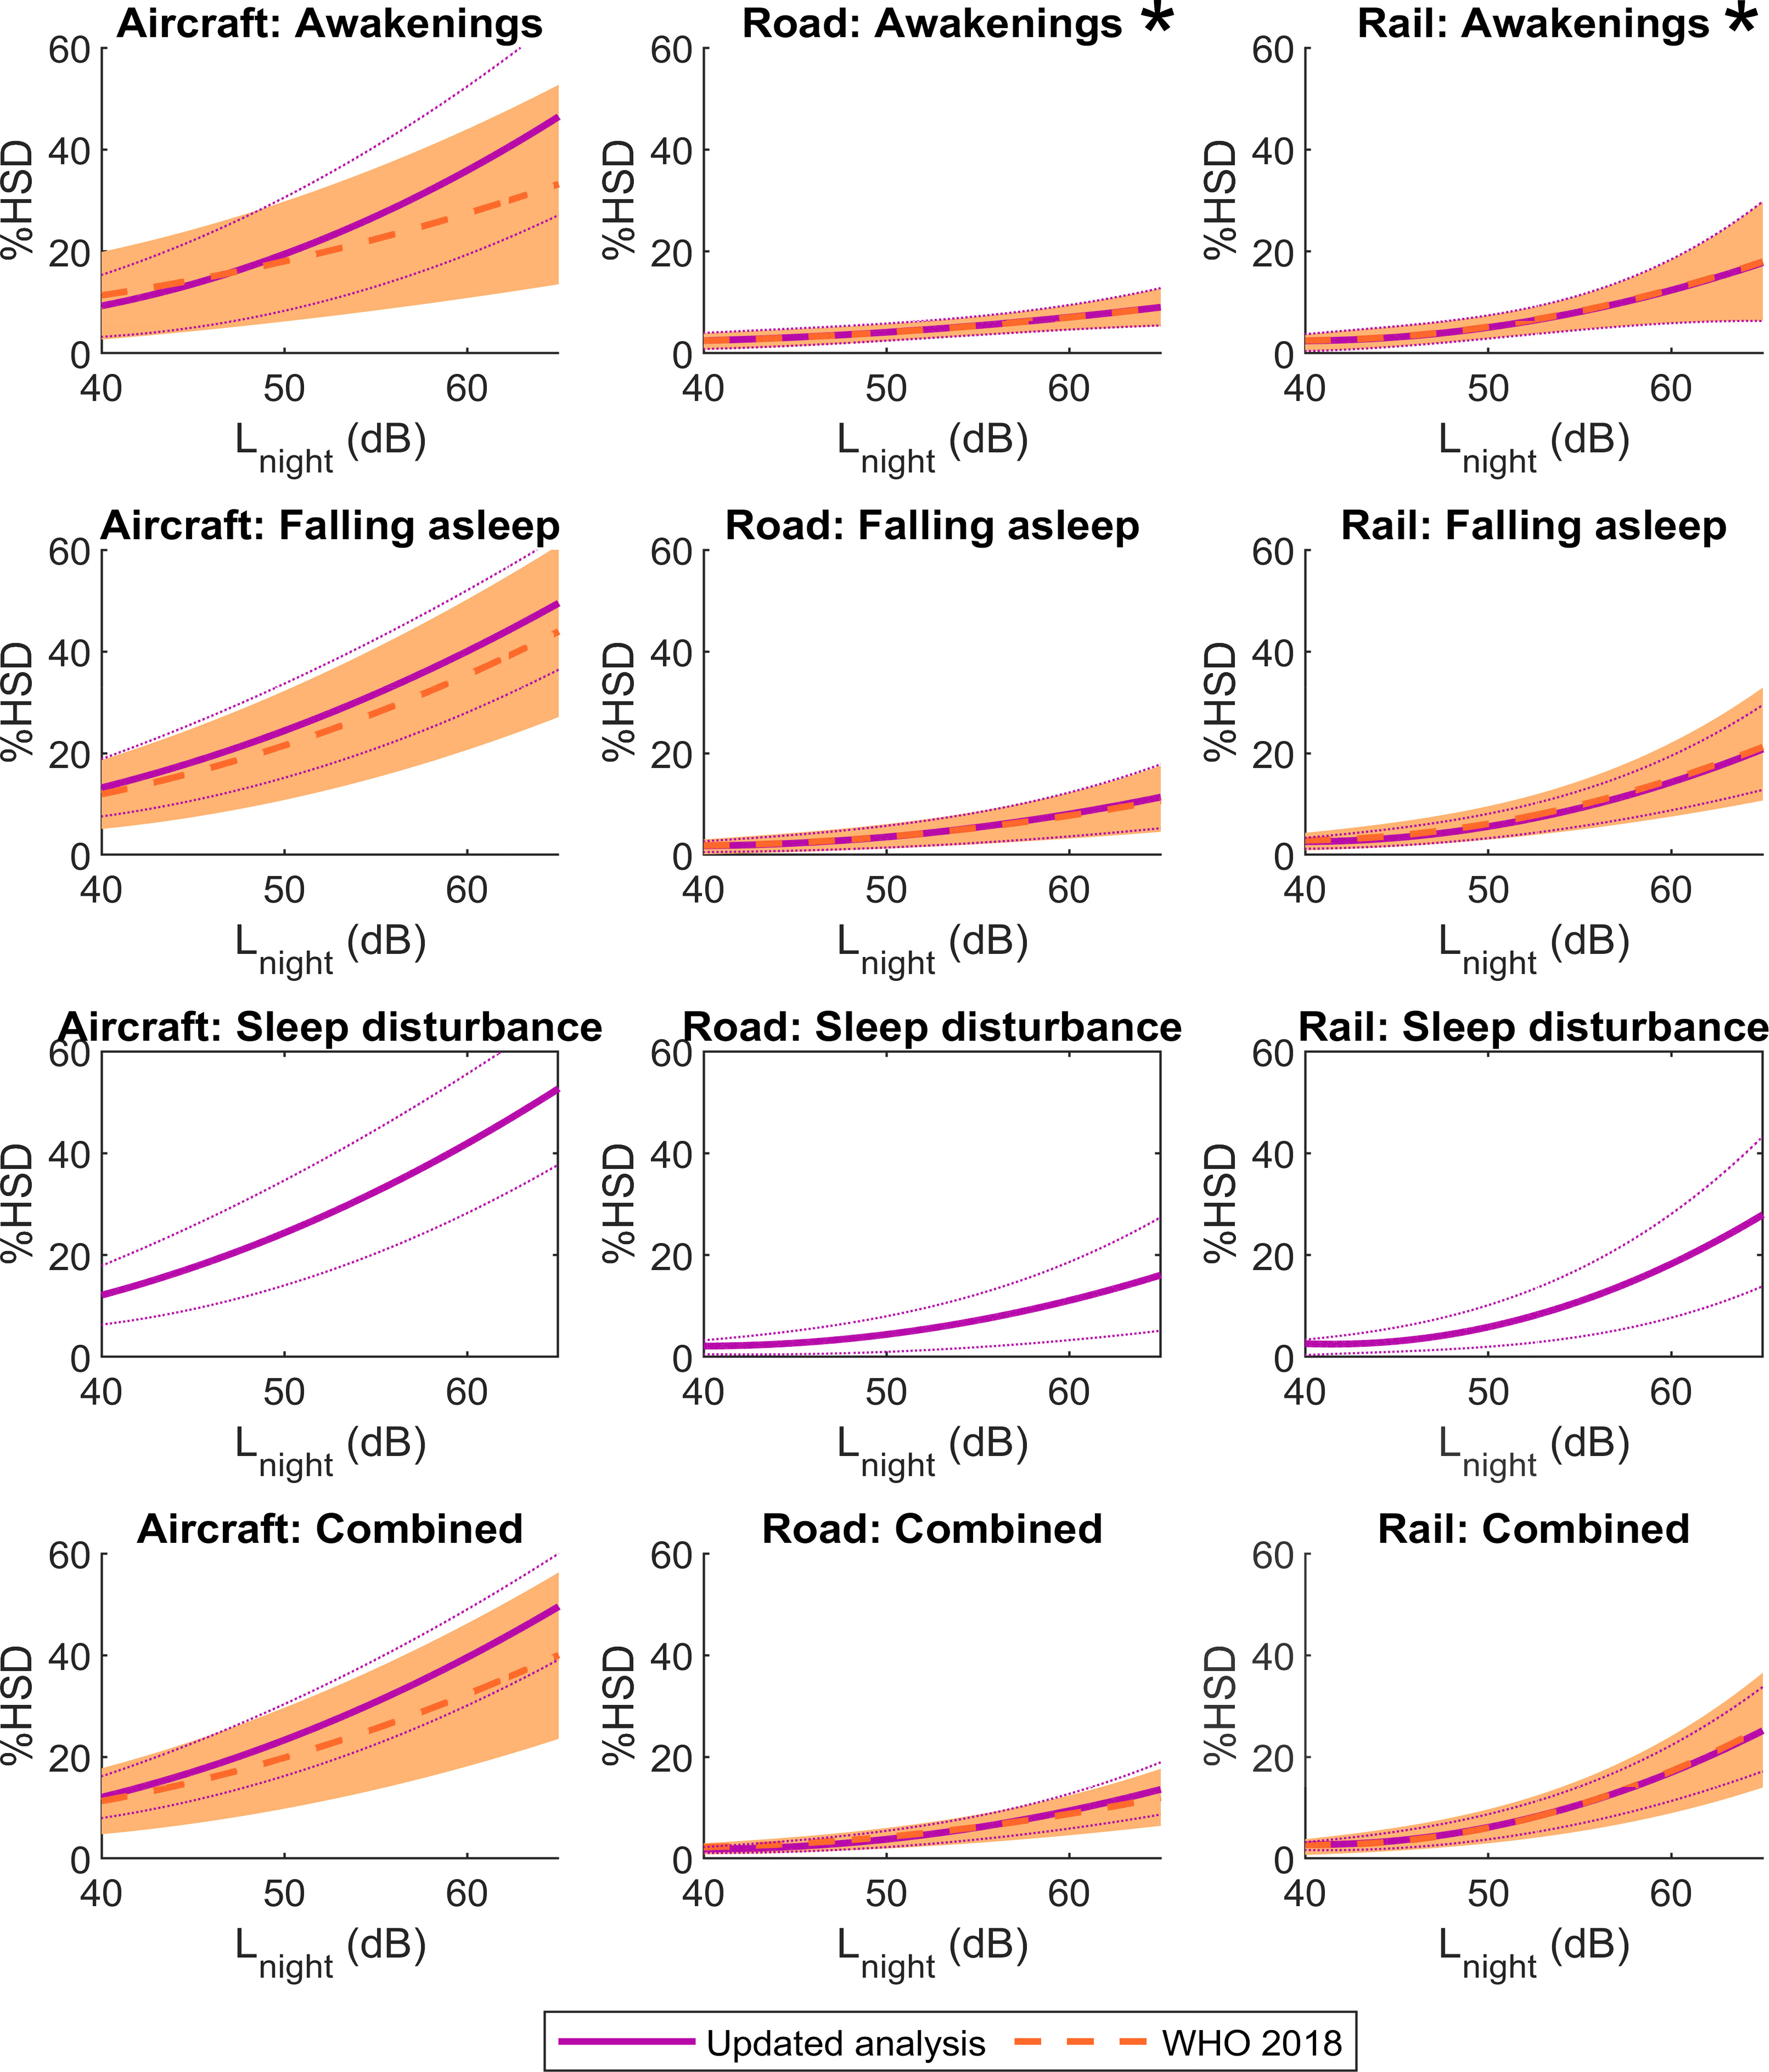
Figure 6.

Probability of being highly sleep disturbed (%HSD) by nighttime noise, determined via questions that mention noise as the source of disturbance, stratified by disturbance question and traffic mode. Exposure–response relationships were derived using all available data, from the original WHO review19 and the 11 newly identified studies. Results of the present updated analysis (solid purple lines with dotted 95% CIs) are compared against results of the 2018 WHO review19 (dashed orange lines with shaded 95% CIs). Relationships for the sleep disturbance questions were not calculated previously. Asterisks (*) indicate sleep outcomes for which no new studies have been published since the WHO review. Parameter estimates were calculated in logistic regression models with included as the only fixed effect and study included as a random effect, restricted to the noise exposure range 40–65 dB . Models were run separately for each traffic mode and disturbance question. The combined estimate was calculated using average responses of the awakening, falling asleep, and sleep disturbance questions within studies. Note: CI, confidence interval; , nighttime noise; WHO, World Health Organization.
