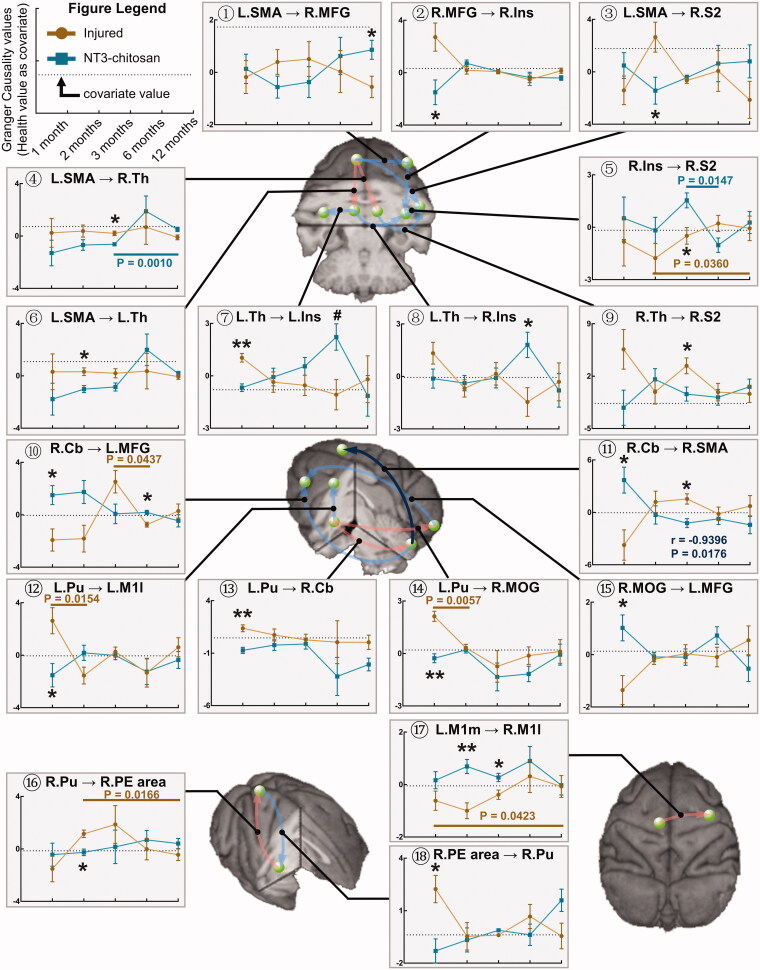
Figure 3.
Brain reorganization processes are mostly independent between the injured and NT3-chitosan-treated groups. Granger Causality connections that were significantly affected by time × group interaction were overlaid on the three-dimensional monkey brain (repeated-measures ANOVA, for detailed values see Supplementary Table 1). Quantitative evaluation was performed to describe the longitudinal variation in the corresponding GCA intensity with time. Light red/blue indicates positive/negative correlations (but not significant) in GCA intensity between the two groups, and dark blue indicates a prominent negative relationship (information flow R.Cb→R.SMA, r and p values are given). Single-factor principal effect analysis showed that the intra-group GCA intensity of injured (brown) and NT3-chitosan (dark cyan) animals altered remarkably among different time points (p values have been given). Inter-group analysis displayed significant differences in GCA intensity at a specific timepoint. Data are presented as mean ± SEM. *p < 0.05; **p < 0.01 (for detailed p values see Supplementary Table 1). L: left; R: right; SMA: supplementary motor area; MFG: middle frontal gyrus; Ins: insula; S2: secondary somatosensory cortex; Th: thalamus; Cb; cerebellum; Pu: putamen; M1l: lateral primary motor cortex; MOG: middle occipital gyrus; PE area: parieto-occipital association cortex; M1m: medial primary motor cortex.

