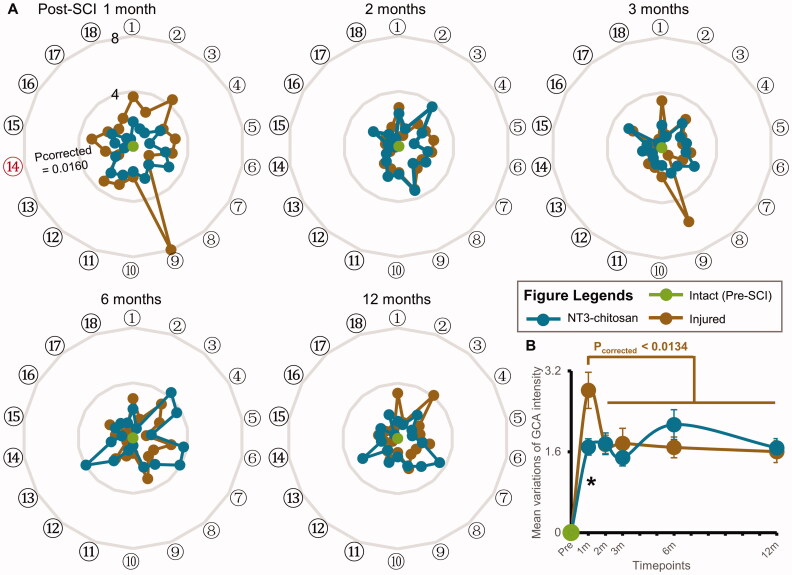
Figure 4.
Intensity changes of brain causal interactions between the injured and NT3-chitosan groups are basically the same. (A) Radar map showing the extent of GCA changes which were significantly affected by time × group interaction. Order numbers were corresponded to the ones also shown in Figure 3. The red serial number indicates a noteworthy difference in variation degree between the two groups (independent t-test with Bonferroni multiple comparisons). (B) Change extent and tendency of GCA intensity with time in the two groups (intra-group: paired t-test with Bonferroni multiple comparisons; inter-group: independent t-test with Bonferroni multiple comparisons, *pcorrected = 0.0369). L: left; R: right; SMA: supplementary motor area; MFG: middle frontal gyrus; Ins: insula; S2: secondary somatosensory cortex; Th: thalamus; Cb: cerebellum; Pu: putamen; M1l: lateral primary motor cortex; MOG: middle occipital gyrus; PE area: parieto-occipital association cortex; M1m: medial primary motor cortex. Order numbers: ①L.SMA→R.MFG, ②R.MFG→R.Ins, ③L.SMA→R.S2, ④L.SMA→R.Th, ⑤R.Ins→R.S2, ⑥L.SMA→L.Th, ⑦L.Th→L.Ins, ⑧L.Th→R.Ins, ⑨R.Th→R.S2, ⑩R.Cb→L.MFG, ⑪R.Cb→R.SMA, ⑫L.Pu→L.M1l, ⑬L.Pu→R.Cb, ⑭L.Pu→R.MOG, ⑮R.MOG→L.MFG, ⑯R.Pu→R.PE area, ⑰L.M1m→R.M1l, ⑱R.PE area→R.Pu.

