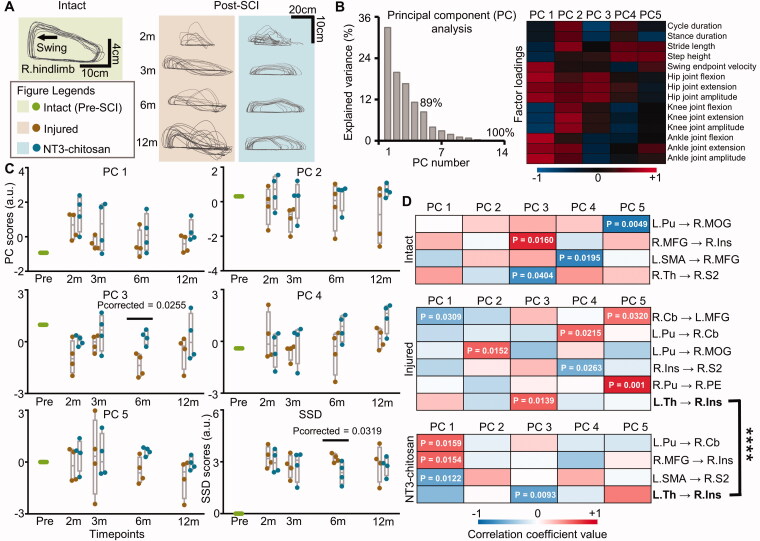
Figure 6.
The injured and NT3-chitosan-treated animals have similar motor adjustments but different relationship modes between motor performance and information flow intensity. (A) Representative limb endpoint trajectories during consecutive stepping on a treadmill pre- and post-SCI showing the recovery of gait performance over time. (B) PCA was used to evaluate all parameters for each gait cycle. The first five PCs (PC1–5) with a cumulative variance interpretation rate of 89% were extracted. The factor loading matrix showed the correlation between each gait variable and each PC. Colour bar represents the value of correlation coefficients. (C) PC1-5 and SSD scores were compared between the two groups (independent t-test with Bonferroni multiple comparisons). SSD score indicated the extent of PC1-5 values which deviated from the intact. Significant differences were observed at 6 months post-SCI. (D) Significant relationships between PC1–5 scores and information flow intensity in animals with intact, injured, or NT3-chitosan treated status were displayed (p values have been given). The two groups showed diverse correlation patterns (Chow-test, ****F1,29 = 20.9057, p = 0.83 × 10⁻⁴). L: left; R: right; m: months; SSD: the sum of square deviation; Pu: putamen; MOG: middle occipital gyrus; MFG: middle frontal gyrus; Ins: insula; SMA: supplementary motor area; Th: thalamus; S2: secondary somatosensory cortex; Cb: cerebellum; PE: parieto-occipital association cortex.

