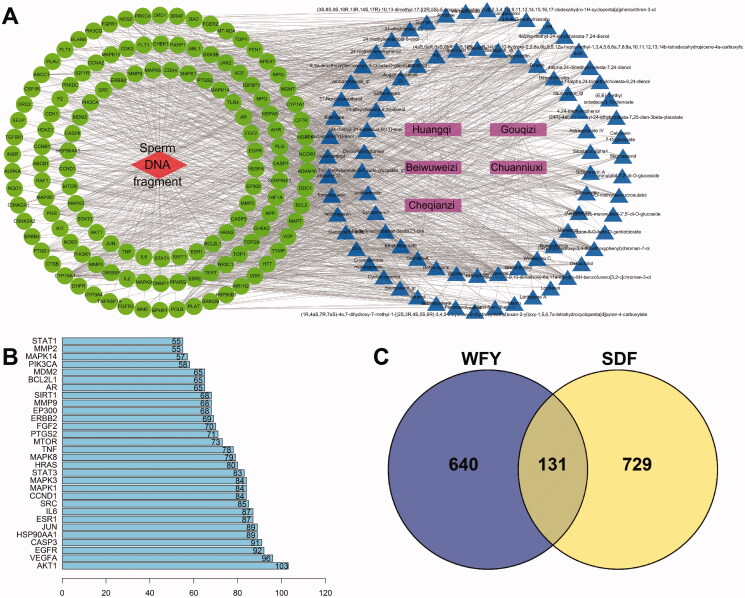
Figure 2.
(A) Network diagram of herb-component-target-SDF interactions. In the figure, pink represents drugs, blue represents 89 active components in WFY, green represents 131 common targets, and red represents disease. (B) Ranking of targets in the PPI chart (top 30). The abscissa indicates the number of protein interactions. (C) Venn diagram of WFY and the target of SDF.

