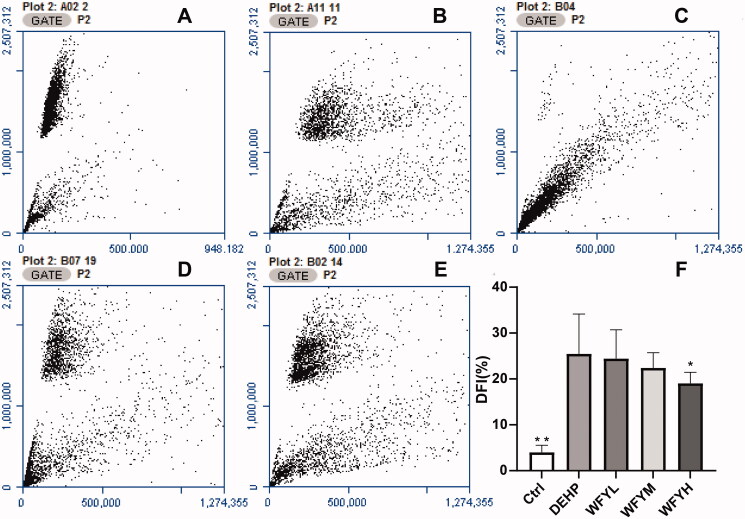
Figure 5.
Sperm chromatin structure assay of sperm cells collected from the cauda epididymis (cauda sperm) in mice after exposure to DEHP. (A–E) Flow cytometry results of DFI (A: control; B: DEHP; C: WFYL; D: WFYM; E: WFYH). (F) Histogram of the flow cytometry results. Data are presented as the mean ± SE. By one-way ANOVA, asterisks showed significant differences between the DEHP group and the other two groups (**p < 0.01, *p < 0.05).

