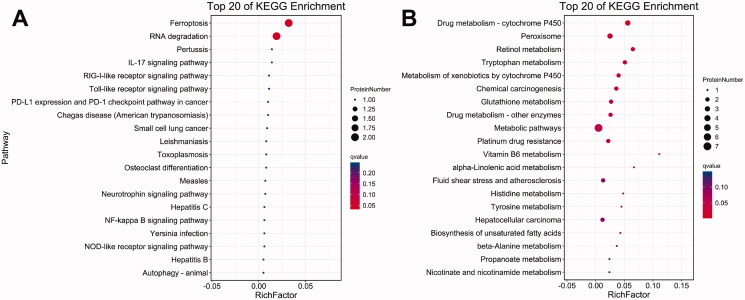
Figure 11.
KEGG enrichment bubble diagram of DEPs: the top 20 pathways with the lowest Q-value are plotted, the vertical axis is the pathway, and the abaxial axis is enrichment factor (divided by the number of different proteins in the pathway); size represents the number, and the redder the colour is, the lower the Q-value is. (A) Profile 2; (B) profile 5.

