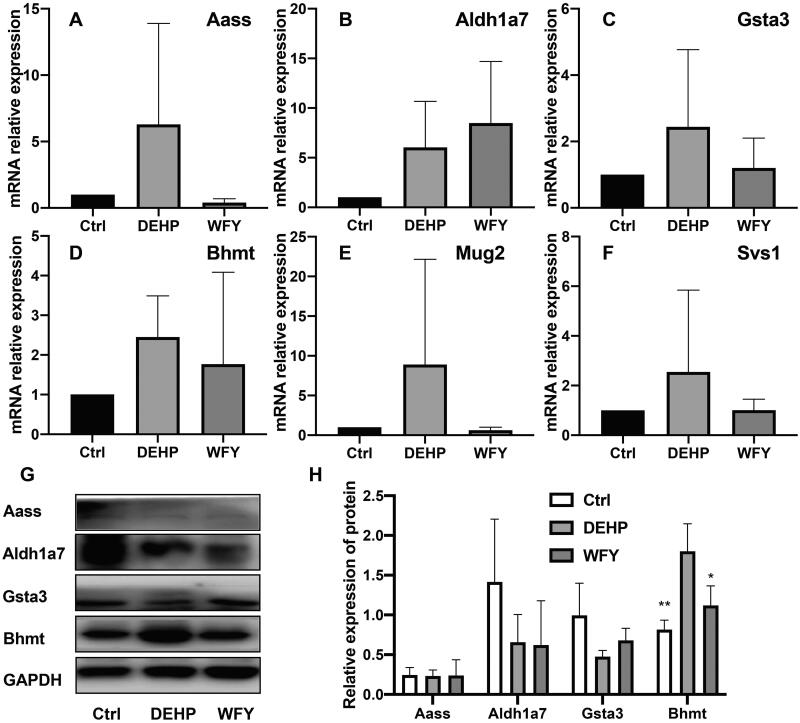
Figure 14.
The expression levels of Aass, Aldh1a7, Gsta3, Bhmt, Mug2 and Svs1 were screened from nine quadrant diagrams by qRT-PCR and Western blot. (A–F) qRT-PCR. (G) Western blot. (H) OD value of Western blot. Mean ± SD, n = 3 in qRT-PCR and Western blot. Compared to the control group, *p < 0.05, **p < 0.01.

