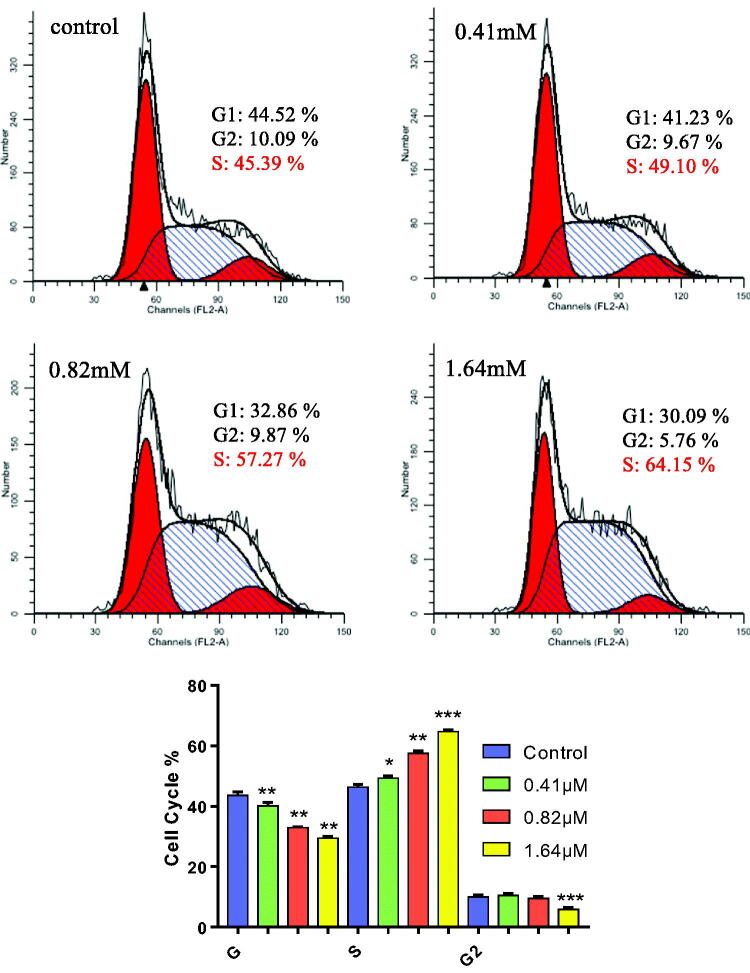
Figure 3.
MDA-MB-231 cells were treated with 7Cc and Cells were stained with PI and investigated by flow cytometry. Data are represented as mean ± SD of three independent experiments. *p < 0.05, **p < 0.01, ***p < 0.001 vs control group. Statistical analyses were carried out on GraphPad.Prism software under ordinary one-way ANOVA method and compared with the control group.

