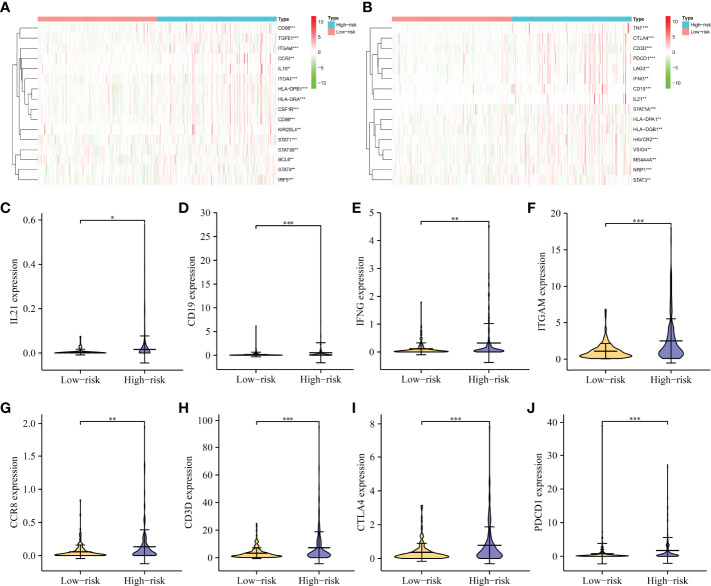
Figure 11.
The expression levels of immune-infiltrating cell markers in high- and low-risk groups. (A, B) A heatmap showing the expression pattern of immune genes in HCC tissues. (C–J) Violin showing the expression of IL21, CD19, IFNG, ITGAM, CCR8, CD3D, CTLA4, and PDCD1 in HCC tissues. HCC, hepatocellular carcinoma; *P < 0.05; **P < 0.01; ***P < 0.001.

