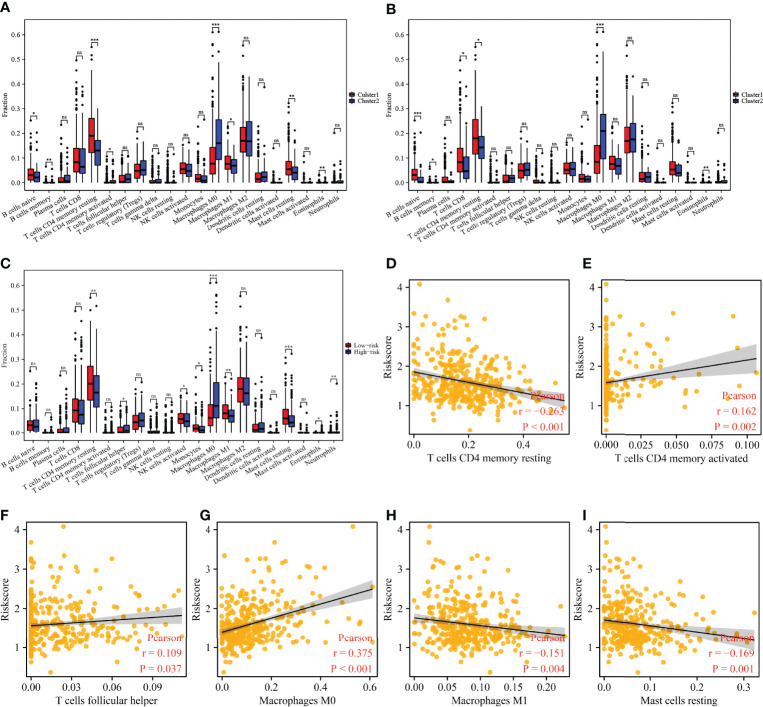
Figure 9.
The correlation between the cluster groups and risk model and immune cell infiltration in HCC. (A) The expression levels of immune cells in m6A/m1A/m5C regulated gene subgroups. (B) The expression levels of immune cells in 37 cluster-related DEG subgroups. (C) The expression levels of immune cells in high- and low-risk groups. (D–I) Correlation between the risk model and immune cells. HCC, hepatocellular carcinoma; differentially expressed genes; ns, not statistically significant; *P < 0.05; **P < 0.01; ***P < 0.001.

