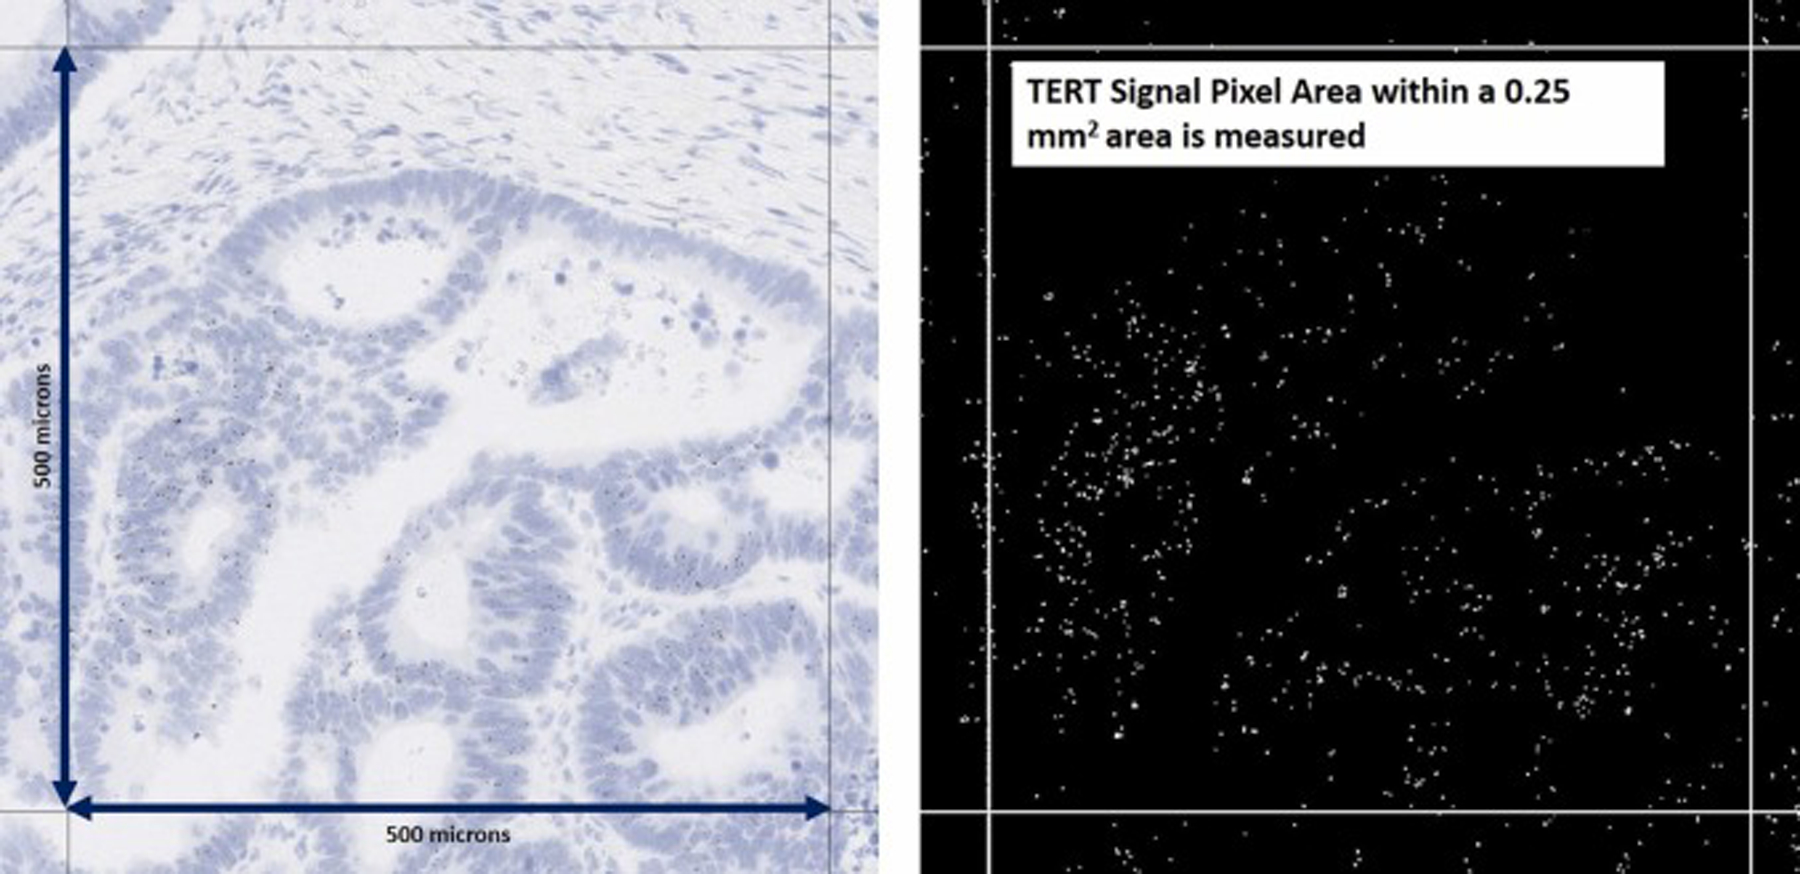
Fig. 2.

Approach 1 tested for the quantification of TERT ISH expression. In this second approach for quantifying TERT ISH expression, the number of TERT signals in a preset (e.g. 100, 200, 300, …) number of cells with highest TERT expression (here quantification is showed based on a 100-cell count) was counted and a signal to cell ratio calculated.
