Figure 6.

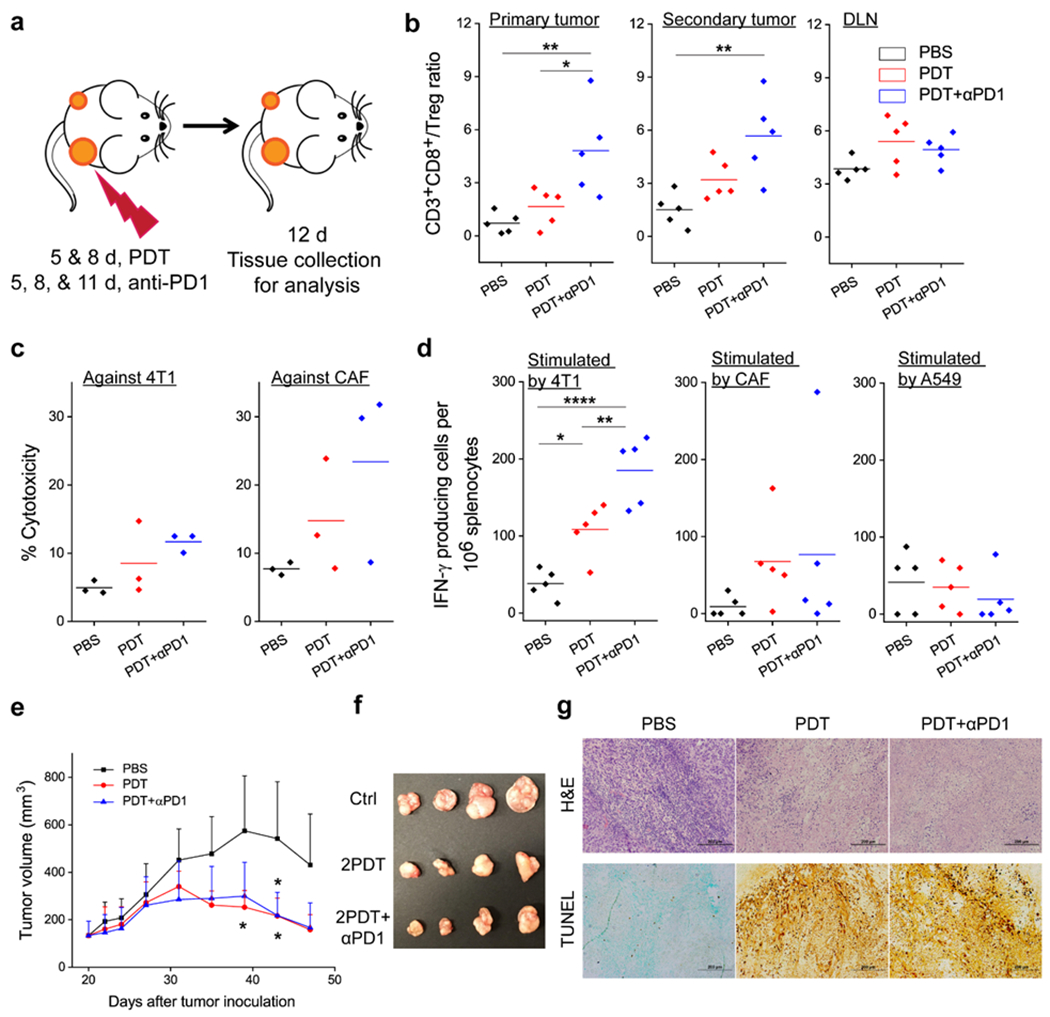
αFAP PDT induces anti-cancer and anti-CAF immunity. (a) Schematic showing the treatment plan. Combination therapy with αFAP PDT and anti-PD1 was performed on bilateral 4T1 tumor models. (b) CD3+CD8+ to Treg (CD3+CD4+FOXP3+) ratios in primary tumor, secondary tumor, and tumor-draining lymph node (DLN), based on flow cytometry analysis. (c) Cell-specific cytotoxicity. Splenocytes were taken from animals receiving PDT, PDT+αPD1 combination therapy, or PBS, and were incubated in vitro with carboxy-fluorescein succinimidyl ester (CFSE)-labeled 4T1 and CAF cells. Cytotoxicity was assessed by propidium iodide (PI) staining followed by flow cytometry analysis. (d) Enzyme-linked immune absorbent spot (ELISpot) analysis. Splenocytes were taken from animals receiving PDT, PDT+αPD1 combination therapy, or PBS, and were incubated in vitro with 4T1, CAF, or A549 cell debris. IFN-γ producing cells were quantified. Cell debris was obtained by treating cells with 100 Gy radiation. (e) Growth curves of A549 tumors after adoptive cell transfer. 4T1 bearing BALB/c mice were treated with PDT, PDT+αPD1, or PBS. Non-adherent splenocytes were isolated and injected into A549 bearing nude mice. Significant difference was observed between PBS and PDT or PDT+αPD1 groups. (f) Photograph of A549 tumors taken on 47 post A549 inoculation. (g) Photograph of A549 tumors taken on 47 post A549 inoculation. (h) H&E and TUNEL staining, performed with A549 tumors taken on Day 47. *, P < 0.05; **, P < 0.01; ***, P < 0.001; ****, P < 0.0001.
