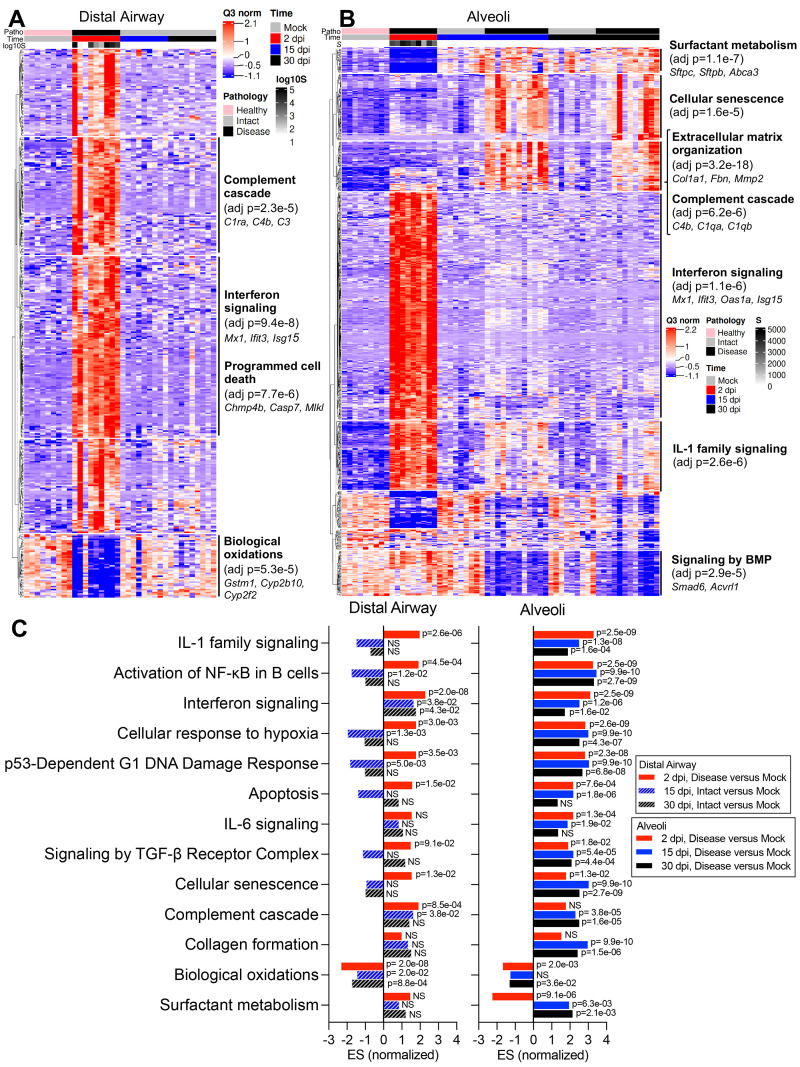
Fig. 3.
Digital spatial profiling reveals distinct transcriptional pathway changes during acute and late stages of SARS-CoV-2 disease. (A and B) DSP heatmaps are shown for differentially expressed genes (DEGs) in ROIs across all time points in (A) distal airway and (B) alveolar tissue compartments. DEGs were obtained by comparing DSP Q3 normalized counts of transcripts between ROIs at 2, 15, and 30 dpi versus mock-infected 1-year-old female BALB/c mice. (C) Normalized enrichment scores (ES) and adjusted p-values obtained by DSP pathway enrichment analysis are shown for distal airway and alveolar ROIs at 2, 15, or 30 dpi versus mock. Statistical analyses used are detailed in methods. NS, not significant.

