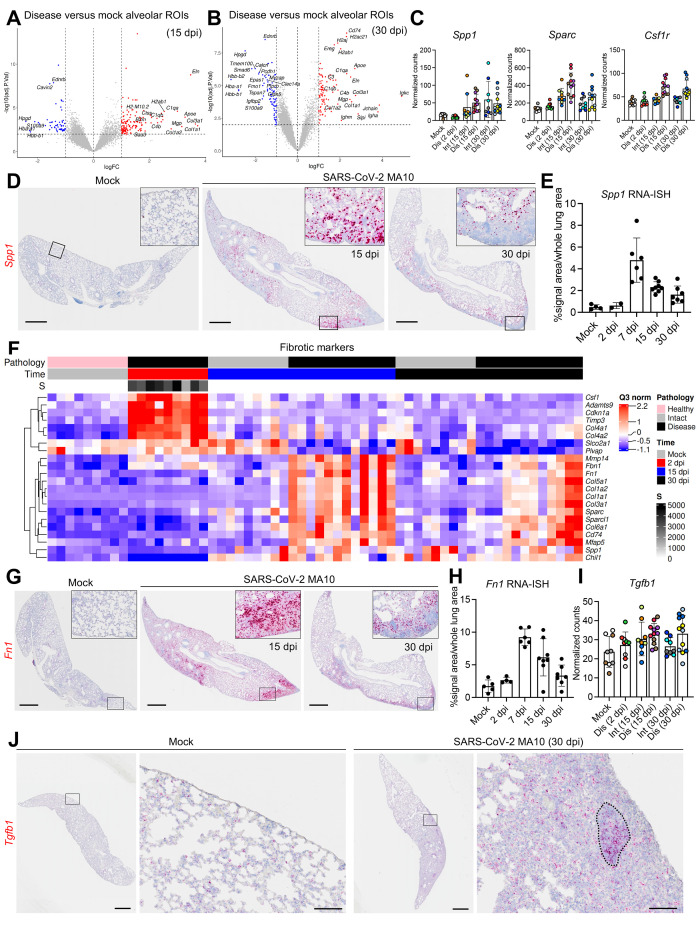
Fig. 6.
SARS-CoV-2 MA10 infection induces profibrotic gene expression at late time points. (A and B) Volcano plots of DSP DEGs are shown for diseased alveolar ROIs at (A) 15 and (B) 30 dpi versus mock 1-year-old female BALB/c mice. (C) DSP Q3 normalized counts of Spp1, Sparc, and Csf1r expression associated with profibrotic macrophage archetype are shown for mock, infected diseased (Dis), or intact (Int) ROIs at indicated time points in 1-year-old female BALB/c mice. (D and E) Spp1 expression was measured by RNA-ISH (D) and quantified and normalized to whole lung area (E). Scale bars indicate 1 mm. (F) DSP heatmap of selected profibrotic and fibrosis related genes in alveolar ROIs are shown for mock, 2, 15, and 30 dpi 1-year-old female BALB/c mice. DSP Q3 normalized counts of SARS-CoV-2 MA10 Spike (S) of ROIs are represented by gray color intensity. (G and H) Fn1 expression (red) by RNA-ISH (G) with quantification (H) is shown. Scale bars indicate 1 mm. (I) DSP Q3 normalized counts of Tgfb1 (red) expression in alveolar ROIs was quantified at indicated time points in mock or SARS-CoV-2 MA10-infected 1-year-old female BALB/c mice. (J) Tgfb1 expression was measured by RNA-ISH in subpleural diseased regions in a SARS-CoV-2 MA10 infected mouse at 30 dpi compared to mock. Scale bars = 1 mm (low power) and 100 μm (high power). DSP Q3 normalized count graphs in (C and I) represent all ROIs selected with each unique color representing one animal, bars represent average value of each group with error bars representing standard error of the mean . RNA-ISH quantification graphs (E and H) represent average value of each group with error bars representing standard error of the mean.

