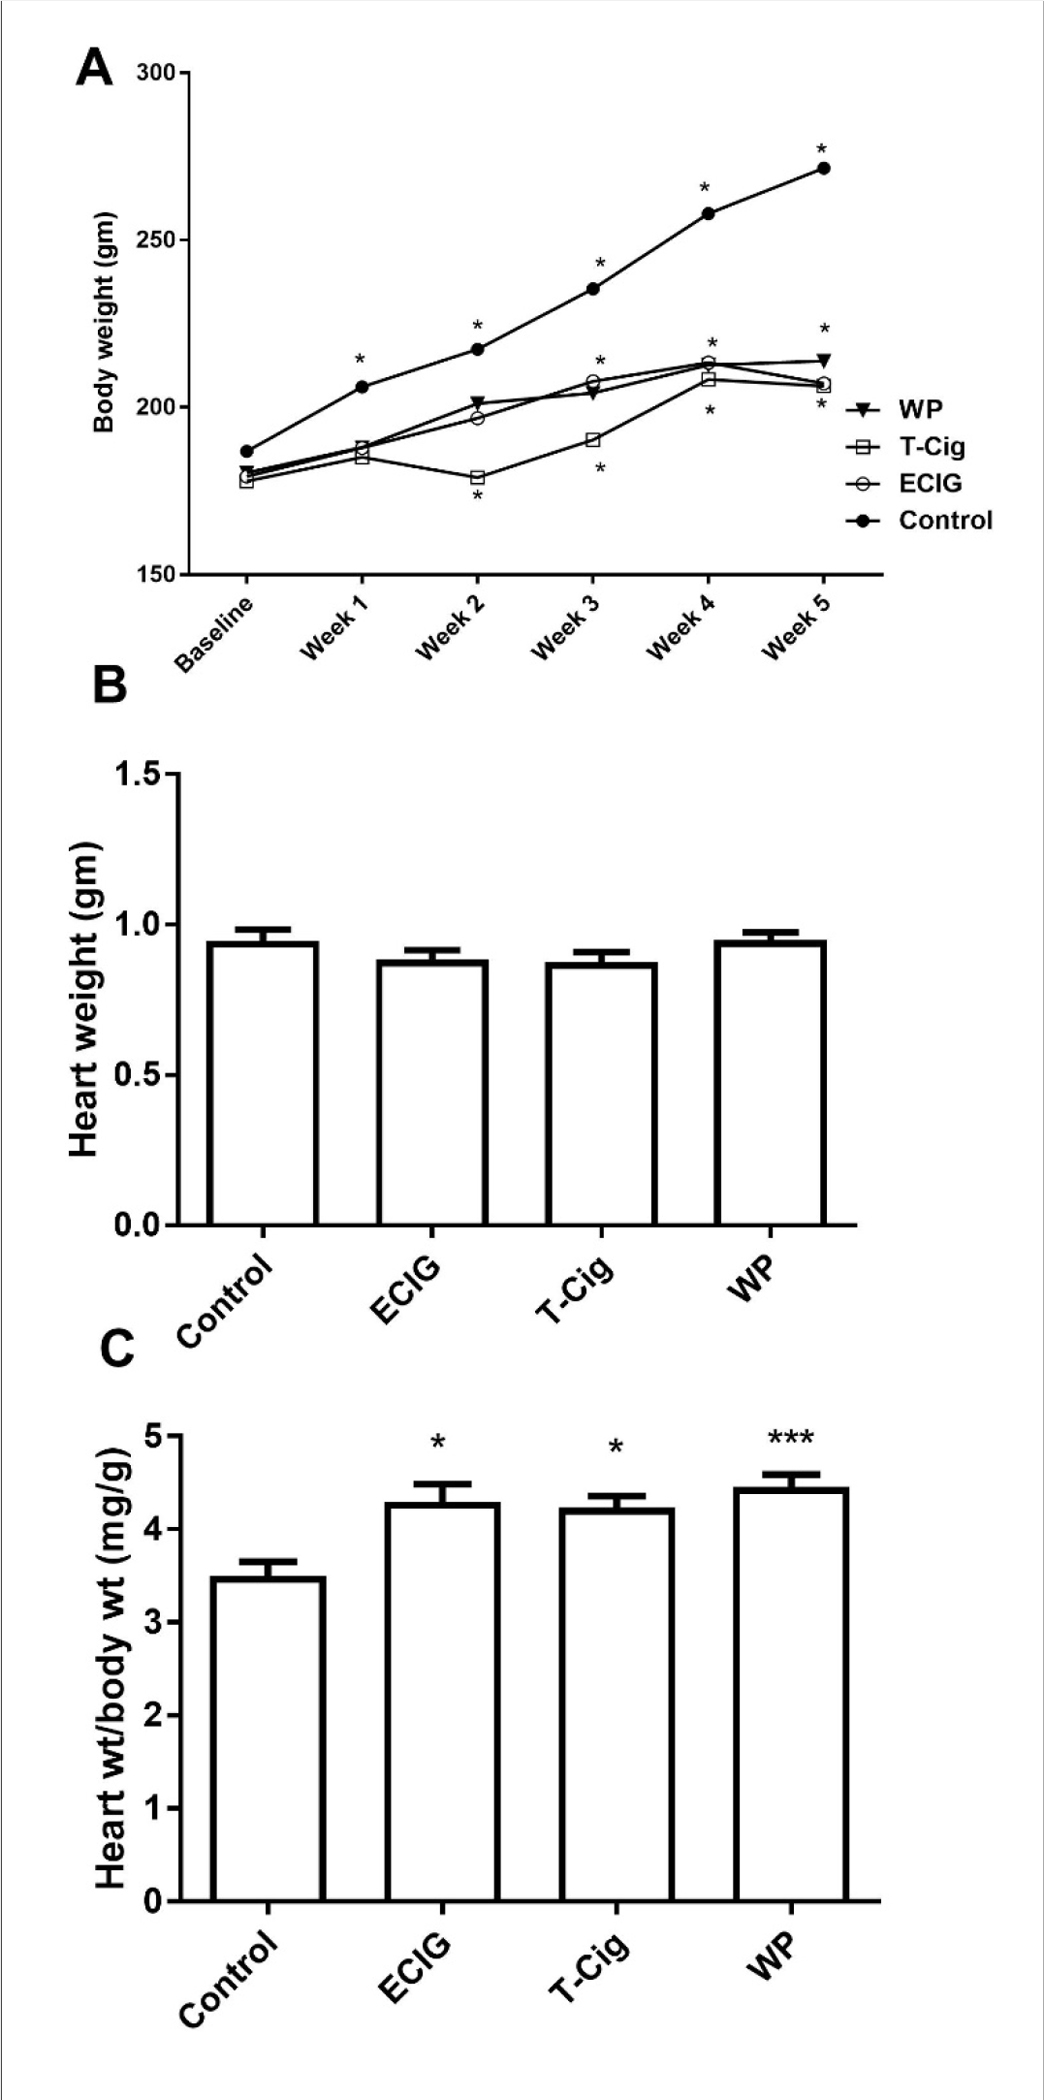
Figure 1: Heart and body weight.

Changes in body weight (A), heart weight (B) and heart to body weight ratio (C) for control, ECIG, T-Cig, and WP. P*<0.05, ***p<0.001 vs. Control; Dunn’s post hoc test, n=12–15 each group.

Changes in body weight (A), heart weight (B) and heart to body weight ratio (C) for control, ECIG, T-Cig, and WP. P*<0.05, ***p<0.001 vs. Control; Dunn’s post hoc test, n=12–15 each group.