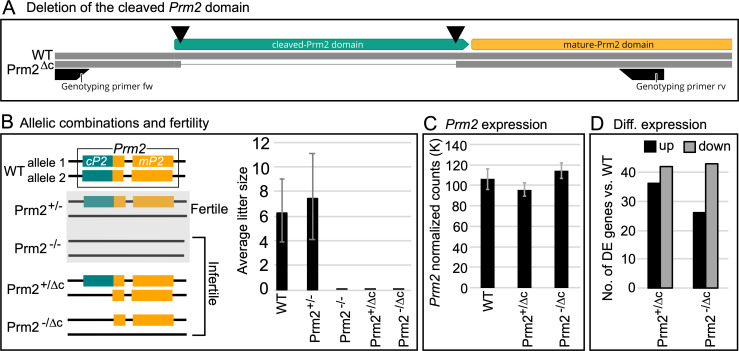
Fig 1. Gene editing, fertility and expression.
(A) Schematic representation of the generation of cP2 deletion. Double strand breaks induced by Cas9 indicated by black triangles. (B) Schematic overview of analyzed genotypes and fertility. Prm2+/- and Prm2-/- [6] were included as a comparison. Bar plot of average litter size for WT, Prm2+/-, Prm2-/-, Prm2+/Δc and Prm2-/Δc, n = 5 for each genotype. (C) Bar plot showing average DESeq2 normalized read counts of Prm2 for WT, Prm2+/Δc and Prm2-/Δc. (D) Bar plot showing comparison between number of differentially higher and lower expressed genes for Prm2+/Δc and Prm2-/Δc compared to wildtype.

