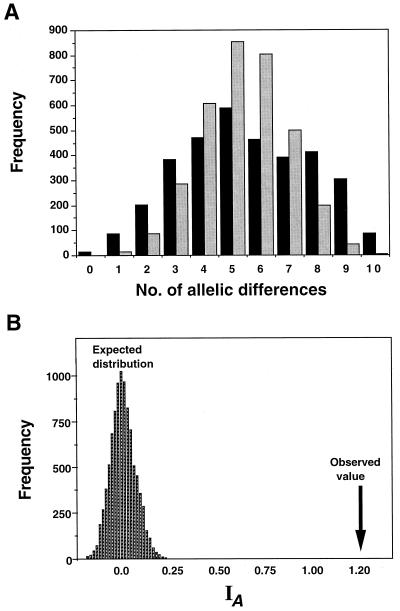
FIG. 2.
(A) The allele mismatch distribution in Ontario isolates of M. anisopliae (gray bars) and the mean value of 10,000 computer-generated replicates by random sampling of alleles (black bars). The haplotype of each theoretical fungal isolate was generated by random sampling of alleles at each locus using allele frequencies found in the observed population. Allele mismatch distributions for each pairwise comparison were calculated, and the value for the observed population was compared to the mean value for the computer-generated theoretical populations (i.e., 3,403 pairwise comparisons [n = 83] in each of the 10,000 computer-generated populations). The computer-generated distribution is unimodal, while the observed population shows a bimodal distribution pattern and an inflated variance owing to linkage disequilibrium (B). The IA values were calculated for the 10,000 computer-generated populations. The arrow shows the calculated IA of 1.2 in the observed population.

