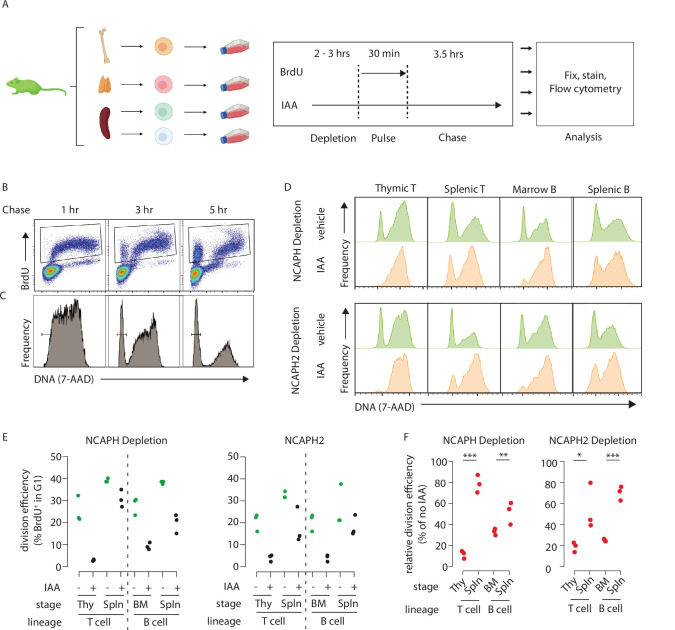
Figure 5. Dynamic changes in condensin dependency during lymphocyte differentiation.
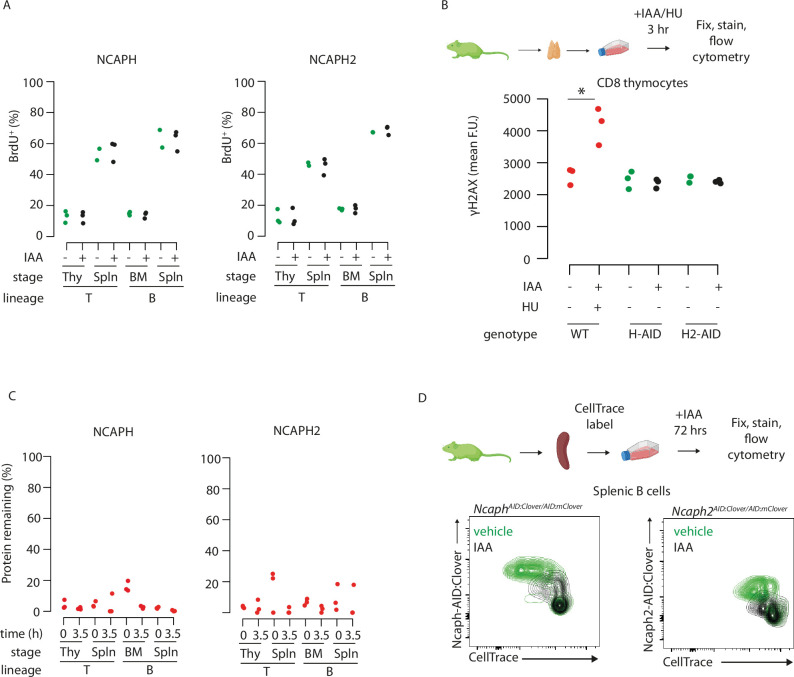
(A) Chronological representation of the BrdU pulse chase assay to measure the efficiency of cell division in primary cell types cultured ex vivo. Lymphocyte isolation and culture protocols are detailed in Materials and methods. Quantifying the % of BrdU+ cells (B) that complete mitosis and halve their DNA content (C) allows the efficiency of a single-cell division to be quantified under normal or acute condensin deficient conditions. The appearance of BrdU+G1 cells can be seen at 3 and 5 hr. (D) Representative DNA content profiles, gated on BrdU+ as shown in panel B, from cycling early (thymic/marrow) or activated mature (Splenic) T and B lymphocytes, measured following a 3.5-hr chase in the presence or absence of condensin I or II. (E) Quantification of division efficiency, based on the % of BrdU+ cells in G1 after 3.5 hr (n = 3 biological replicates from at least 2 independent experiments). Corresponding condensin depletion levels for each experiment are shown in Figure 5—figure supplement 1C (F). Quantification of the effect of NCAPH or NCAPH2 degradation on cell division across cell types in panel E. For each cell type, division efficiency (panel E) in the vehicle only control condition was set to 100%, and the same parameter in IAA-treated cells was expressed relative to this. Asterisks represent p values from paired t-tests ***p < 0.01, **p < 0.05, *p < 0.1.


