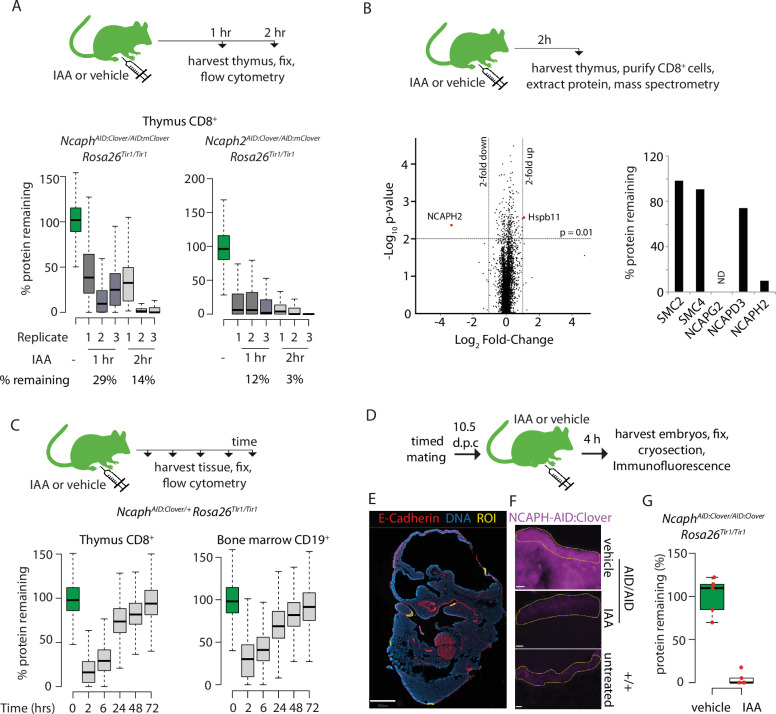
Figure 6. Rapid degradation of endogenous tagged proteins in living mice.
(A) (Top) I.P. injection time course to test protein degradation in vivo. Each mouse received a single injection of IAA solution (100 mg/kg), or vehicle. (Bottom) Boxplots show the extent of targeted protein degradation in >1000 S/G2/M CD8+ thymocytes harvested 1 or 2 hr following auxin injection, measured by flow cytometry. % protein remaining was calculated as described in Figure 2 legend. Boxes indicate the boundaries of upper and lower quartiles and whiskers show the range. Data are from three biological replicate injections performed over at least two independent experiments. (B) Proteome quantification by mass spectrometry analysis of MACS-purified CD8+ thymocytes. n = 3 animals per condition. (C) Protein degradation and recovery following a single I.P. injection. Data are presented as described for panel A, except mice were heterozygous for the Ncaph2AID:Clover allele. (D) Schematic illustration of experimental workflow for protein degradation in E10.5 embryos. (E) Example image from whole-mount immunofluorescence performed on E10.5 embryo cryosections, stained with DAPI, anti-GFP-647 nanobooster (detecting NCAPH-AID:Clover), and anti-CDH1. Anti-GFP signal was quantified within five CDH1+ regions of interest (ROI) per embryo, which were selected based solely on the CDH1 staining pattern. To enable CDH1 localisation and ROIs to be visualised, the anti-GFP-647 channel is not shown in this panel. Images were captured at ×40 magnification, scale bar = 800 μm. (F) Example ROI’s from CDH1+ stained tissue on which target protein quantification was performed. To visualise degradation, only the NCAPH-AID:Clover channel is shown. Scale bar = 10 μm. (G) Quantification of degradation efficiency in CDH1+ embryonic cells. Mean pixel intensity was first calculated from five Cdh1+ regions in NcaphAID:Clover/AID:Clover Rosa26Tir1/Tir1 embryos from mothers injected with either IAA or vehicle, and non-fluorescent negative control embryos (n = 1 embryo each). The mean pixel intensity value from negative control ROIs was set to 0%, and the mean value from vehicle-only ROIs to 100%. Mean pixel intensity values for each ROI from vehicle and IAA-exposed embryos were then plotted on this scale. Negative values were set to 0%.


