. 2022 Jun 22;11:e78496. doi: 10.7554/eLife.78496

Figure 3. BMAd lipolysis is required to maintain bone homeostasis in male mice under CR conditions, but not when mice are fed ad libitum.

(A-C) Male BMAd-Pnpla2-/- and their BMAd-Pnpla2+/+ littermates with ad libitum feeding were euthanized at 24 weeks of age. Two independent age- and sex- matched cohorts were plotted together. Tibiae from ad libitum mice were analyzed by μCT for indicated trabecular (Tb.) bone variables. BV/TV: bone volume fraction; Conn. Dens: connective density; BMD: bone mineral density; N: number; Th: thickness; Sp: separation. Scale bars indicate 500 μm. (D-M) Male mice at 18 weeks of age underwent 30% CR for 6 weeks. Two independent age- and sex- matched cohorts were plotted together for μCT parameters (D-F), one of those two cohorts was used for ELISA, and static or dynamic histomorphometry (G-M). (D-F) Tibiae from CR mice were analyzed by μCT for indicated trabecular bone variables. Scale bar; 500 μm. (G-H) Static histomorphometry analyses were performed to calculate osteoblast number (Ob. N), osteoclast number (OC. N) and osteoclast surface (Oc. S) per bone surface (BS). (I-J) Concentrations of circulating P1NP and TRACP5b in CR mice were measured. (K) Osteoid quantification was performed on undecalcified plastic sections with Goldner’s Trichrome staining. (L-M) Dynamic histomorphometry was performed on calcein-labelled trabecular bone from proximal tibia. sLS: single-labelled surface; MS: mineralized surface; Ir.L.Wi: inter-label width; MAR: mineral apposition rate. Data are expressed as mean ± SD. * indicates p<0.05 with a two-sample t-test. In addition, multiple unpaired t tests had been performed crossing all parameters, p values were adjusted for multiple comparisons using Two-stage step-up (Benjamini, Krieger, and Yekutieli) with FDR method. Adjusted p values are shown in Figure 3—source data 1.
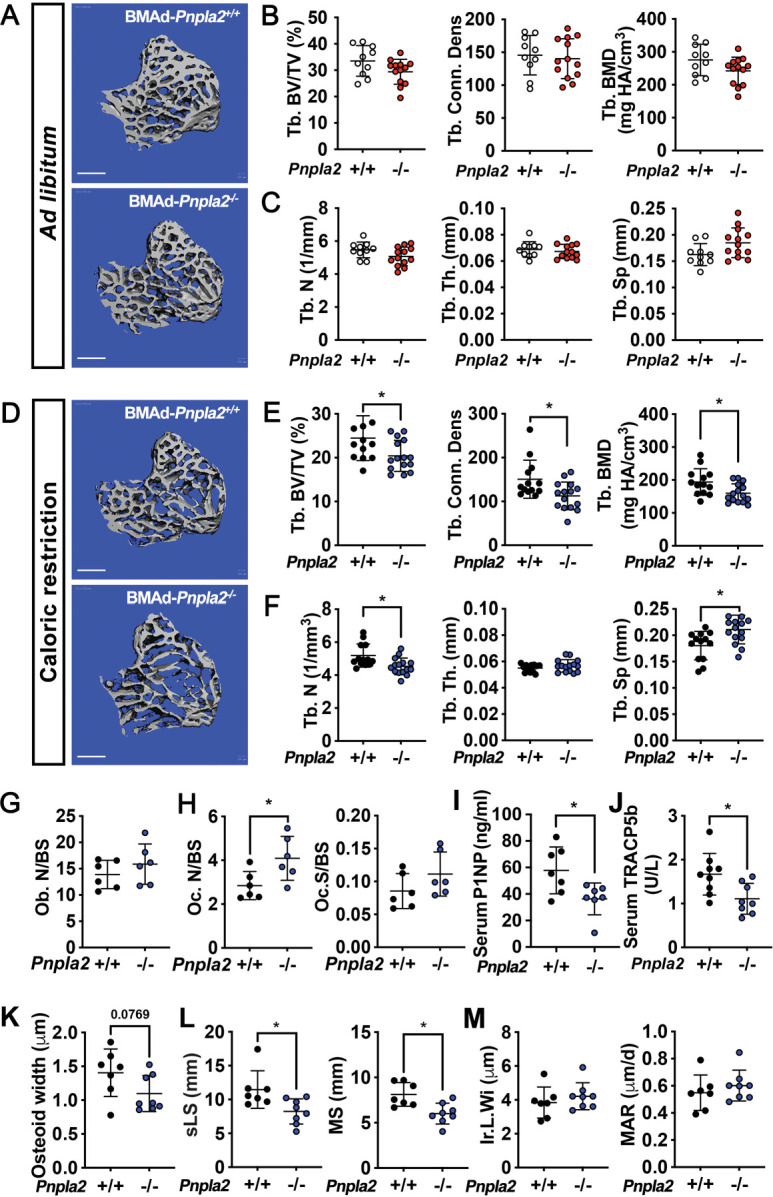
Figure 3—source data 1. BMAd lipolysis is required to maintain bone homeostasis in male mice under CR conditions, but not when mice are fed ad libitum.

Figure 3.

Figure 3—figure supplement 1. Blocking BMAd-lipolysis does not influence global metabolism when mice are fed ad libitum or calorically restricted.

Figure 3—figure supplement 1.

(A-I) BMAd-Pnpla2-/- male mice and littermate controls (Pnpla2+/+) were fed ad libitum until 24 weeks of age. Body weight (A), glucose tolerance test (B), and weights of subcutaneous WAT (sWAT), epididymal WAT (eWAT), and liver (C-E) were recorded. Decalcified tibiae were used for osmium tetroxide-staining and quantified by μCT analyses to measure the BMAT volume from proximal to distal ends, as indicated by boxed regions (F-G). Concentrations of glycerol and NEFA in serum (H) and bone marrow supernatant (I) were measured with colorimetric assay kits. Glycerol and NEFA contents in bone marrow supernatant were normalized to protein concentrations. (J-U) BMAd-Pnpla2-/- male mice and littermate controls (Pnpla2+/+) at 18 weeks of age and underwent a 30% CR for 6 weeks. Body weight changes (J) and glucose tolerance (K) were recorded. sWAT (L), eWAT (M), and liver (N) weights were measured during dissection. BMAT volume at different locations were quantified in osmium tetroxide-stained bones following μCT scanning (O-P). Representative images of proximal tibial rBMAT are shown (Q). Quantitative analyses of BMAd sizes were performed using MetaMorph software (R-S). Concentrations of glycerol and NEFA in serum (T) and bone marrow supernatant (U) were measured using colorimetric assays. Glycerol and NEFA contents in bone marrow supernatant were normalized to protein concentrations. (V) Immunoblot analyses of circulating adiponectin under non-reducing and non-heat-denaturing conditions (top panel), and denaturing conditions (middle panel), with albumin as a loading control (low panel). HMW: high molecular weight forms; MMW: medium molecular weight forms; LMW: low molecular weight. Data are expressed as mean ± SD. * indicates p<0.05 with a two-sample t-test.
Figure 3—figure supplement 1—source data 1. Blocking BMAd-lipolysis does not influence global metabolism when mice are fed ad libitum or calorically restricted.
Figure 3—figure supplement 2. Cortical bone variables in BMAd-Pnpla2-/- mice and other possible mechanisms for bone loss in BMAd-Pnpla2-/- CR mice.
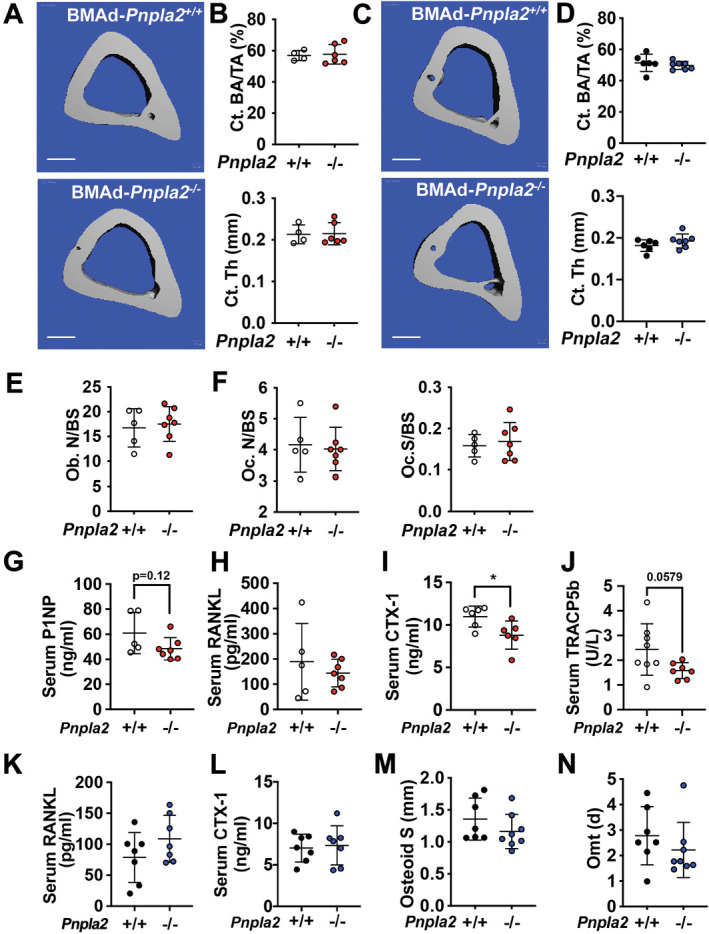
Figure 3—figure supplement 2.

(A-D) Mouse tibiae from 24 weeks old ad libitum (A-B) or CR (C-D) mice were collected. Cortical bone area (CT. BA/TA) and thickness (Ct. Th) were measured by μCT. Scale bar; 500 μm. (E-J) BMAd-Pnpla2-/- male mice and littermate controls (Pnpla2+/+) were fed ad libitum until 24 weeks of age. (E-F) Proximal tibial static histomorphometry was performed to calculate osteoblast number (Ob. N), osteoclast number (OC. N) and osteoclast surface (Oc. S) per bone surface (BS). (G-J) Circulating P1NP, RANKL, CTX-1 and TRACP5b were measured with commercially available ELISA kits. (K-N) BMAd-Pnpla2-/- male mice and littermate controls (Pnpla2+/+) at 18 weeks of age underwent a 30% CR for 6 weeks. (K-L) Circulating RANKL and CTX-1 were measured with commercially available ELISA kits. (M-N) Histomorphometry analysis for osteoid surface and osteoid maturation time (Omt). Data are expressed as mean ± SD. * indicates p<0.05 with a two-sample t-test.
Figure 3—figure supplement 2—source data 1. Cortical bone variables in BMAd-Pnpla2-/- mice and other possible mechanisms for bone loss in BMAd-Pnpla2-/- CR mice.
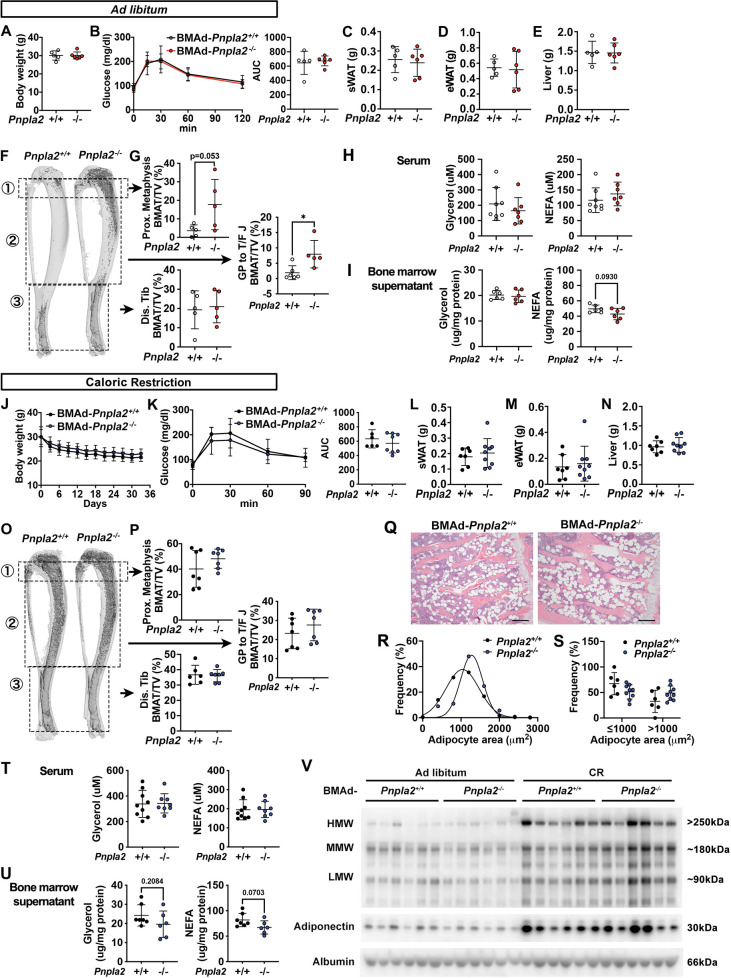
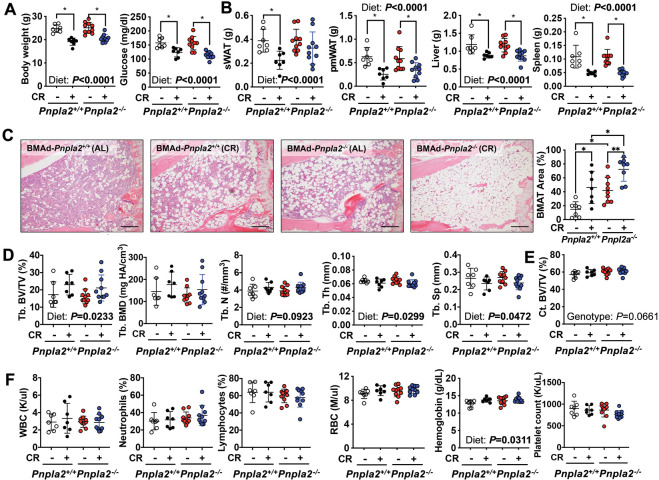
Figure 3—figure supplement 3. BMAd lipolysis is not required in female mice to maintain bone homeostasis under CR conditions.

Figure 3—figure supplement 3.

BMAd-Pnpla2-/- female mice and their wildtype controls (Pnpla2+/+) at 18 weeks of age were fed ad libitum (AL) or underwent a 30% CR for another 6 weeks. (A-B) Final body weight and random glucose levels were measured (A). sWAT, parametrial WAT (pmWAT), liver and spleen weights were recorded during dissection (B). (C) Representative images from proximal tibiae were collected from decalcified and paraffin-sectioned bones. Scale bar; 200 μm. Quantification of BMAT surface area was finished by Image J. (D-E) Trabecular and cortical bone variables were determined by μCT analysis. (F) Complete blood counts (CBC) were performed to measure white and red blood cells in circulation. Data are expressed as mean ± SD. * indicates p<0.05 with two-way ANOVA analysis followed by Šídák’s multiple comparisons test. Significant effects of genotype or diet as well as trends are shown.
Figure 3—figure supplement 3—source data 1. BMAd lipolysis is not required in female mice to maintain bone homeostasis under CR conditions.
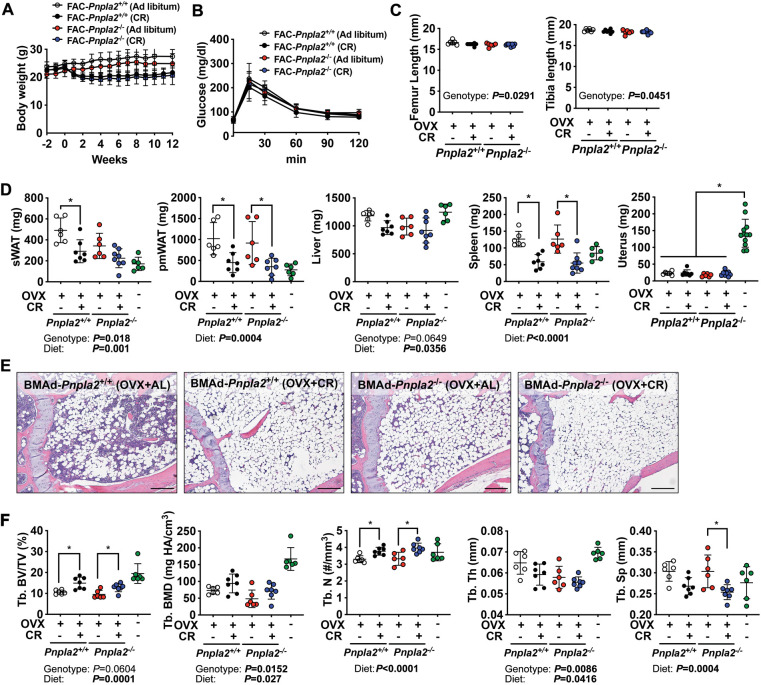
Figure 3—figure supplement 4. BMAd-lipolysis impairment in estrogen-deficient female mice does not affect CR-induced bone changes.

Figure 3—figure supplement 4.

Female mice at 16 weeks of age underwent ovariectomy and recovered for 2 weeks, which were followed by 30% CR for 12 weeks.+ indicates OVX or CR, - indicates sham or ad libitum, respectively. Changes in body weight (A) and glucose tolerance test (B) were recorded. Femoral and tibial lengths were measured (C). Weights of sWAT, pmWAT, liver, spleen, and uterus were measured during dissection (D). Representative images of proximal tibial BMAT were shown (E). Trabecular bone parameters were determined by μCT (F). Tb.: trabecular bone; BV/TV: bone volume fraction; BMD: bone mineral density; N: number; Th: thickness; Sp: separation. Green dots show bone variable measurements from a sex- and age- matched independent cohort of sham ad libitum (OVX -; CR -) mice. Data are expressed as mean ± SD. * indicates p<0.05 with two-way ANOVA analysis followed by Šídák’s multiple comparisons test. Significant effects of genotype or diet as well as trends are shown. Sham ad libitum group is not included for statistical analyses.
Figure 3—figure supplement 4—source data 1. BMAd-lipolysis impairment in estrogen-deficient female mice does not affect CR-induced bone changes.