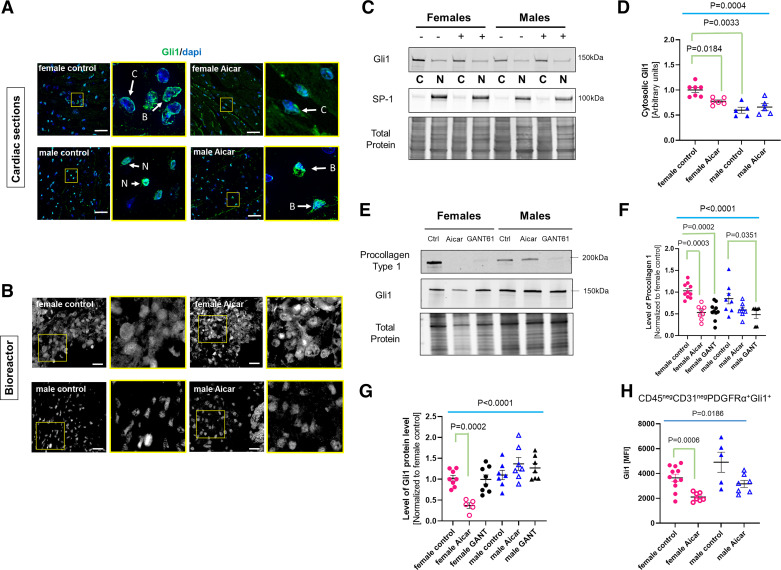
Figure 5.
Differential activation pattern of Gli1 in fibroblasts of 5-aminoimidazole-4-carboxamide riboside (AICAR)-treated old female and male mouse hearts. A: representative immunostaining for Gli1 on cardiac cross sections prepared from control or AICAR-treated old female or male mice. Scale bar = 25 μm. Each picture is paired with a magnified image from the area marked by a yellow square. Arrows indicate the specific cellular localization of Gli1 staining: B, both; C, cytosolic; N, nuclear. Scale bar = 50 μm (n = 3). B: Gli1 staining of cardiac fibroblasts seeded in a bioreactor on age-matched/sex-matched cardiac matrices after 7 days of incubation with 0.5 mM AICAR or DMSO (control). Nonspecific autofluorescence of the matrix was indicated by “N.S.” Scale bar = 50 μm (n = 3). C: representative Western blot showing the distribution of Gli1 between the cytosolic (C) and the nuclear (N) fractions in female and male cells in response to AICAR (+). D: quantification of cytosolic Gli1 from C. E: representative Western blot depicting the change in procollagen type I a1 and Gli1 protein levels in response to 72-h incubation of the fibroblasts with 0.5 mM AICAR or 10 µM GANT61. Ctrl, control cells. Quantification of E for both procollagen (F) type I and Gli1 (G) protein levels (n = 7 or 8 samples/group). H: graph depicting MFI values for Gli1 in cardiac CD45negCD31negPDGFRα+ cell populations in control or AICAR-treated mice analyzed by flow cytometry. Each circle/triangle represents a unique biological replicate (n = 6–12/group). For D, F, and G, P value was calculated by a one-way ANOVA among the four cell groups followed by a post hoc analysis with Tukey correction. For H, Brown–Forsythe and Welch one-way ANOVA was used to test the significant difference among the four groups. P values were adjusted for multiple comparisons.

