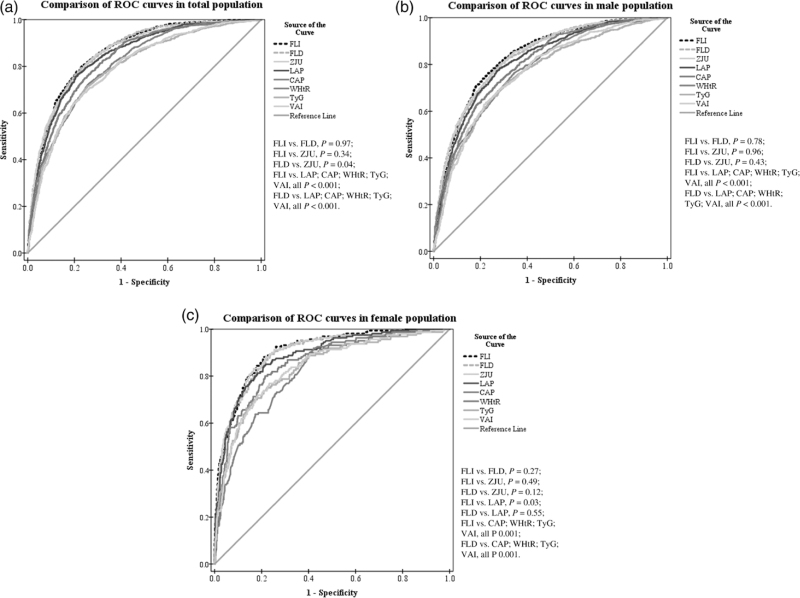
Fig. 2.
Comparison of Receiver-operating characteristic (ROC) curves of the NAFLD-related models for the detection of NAFLD in the validation. (a) Comparison of ROCs in total population. (b) Comparison of ROCs in male population. (c) Comparison of ROCs in female population. Comparisons of the areas under receiver operating characteristic (AUC) curves between FLI and other indexes were performed by the method of DeLong et al. NAFLD, nonalcoholic fatty liver disease.

