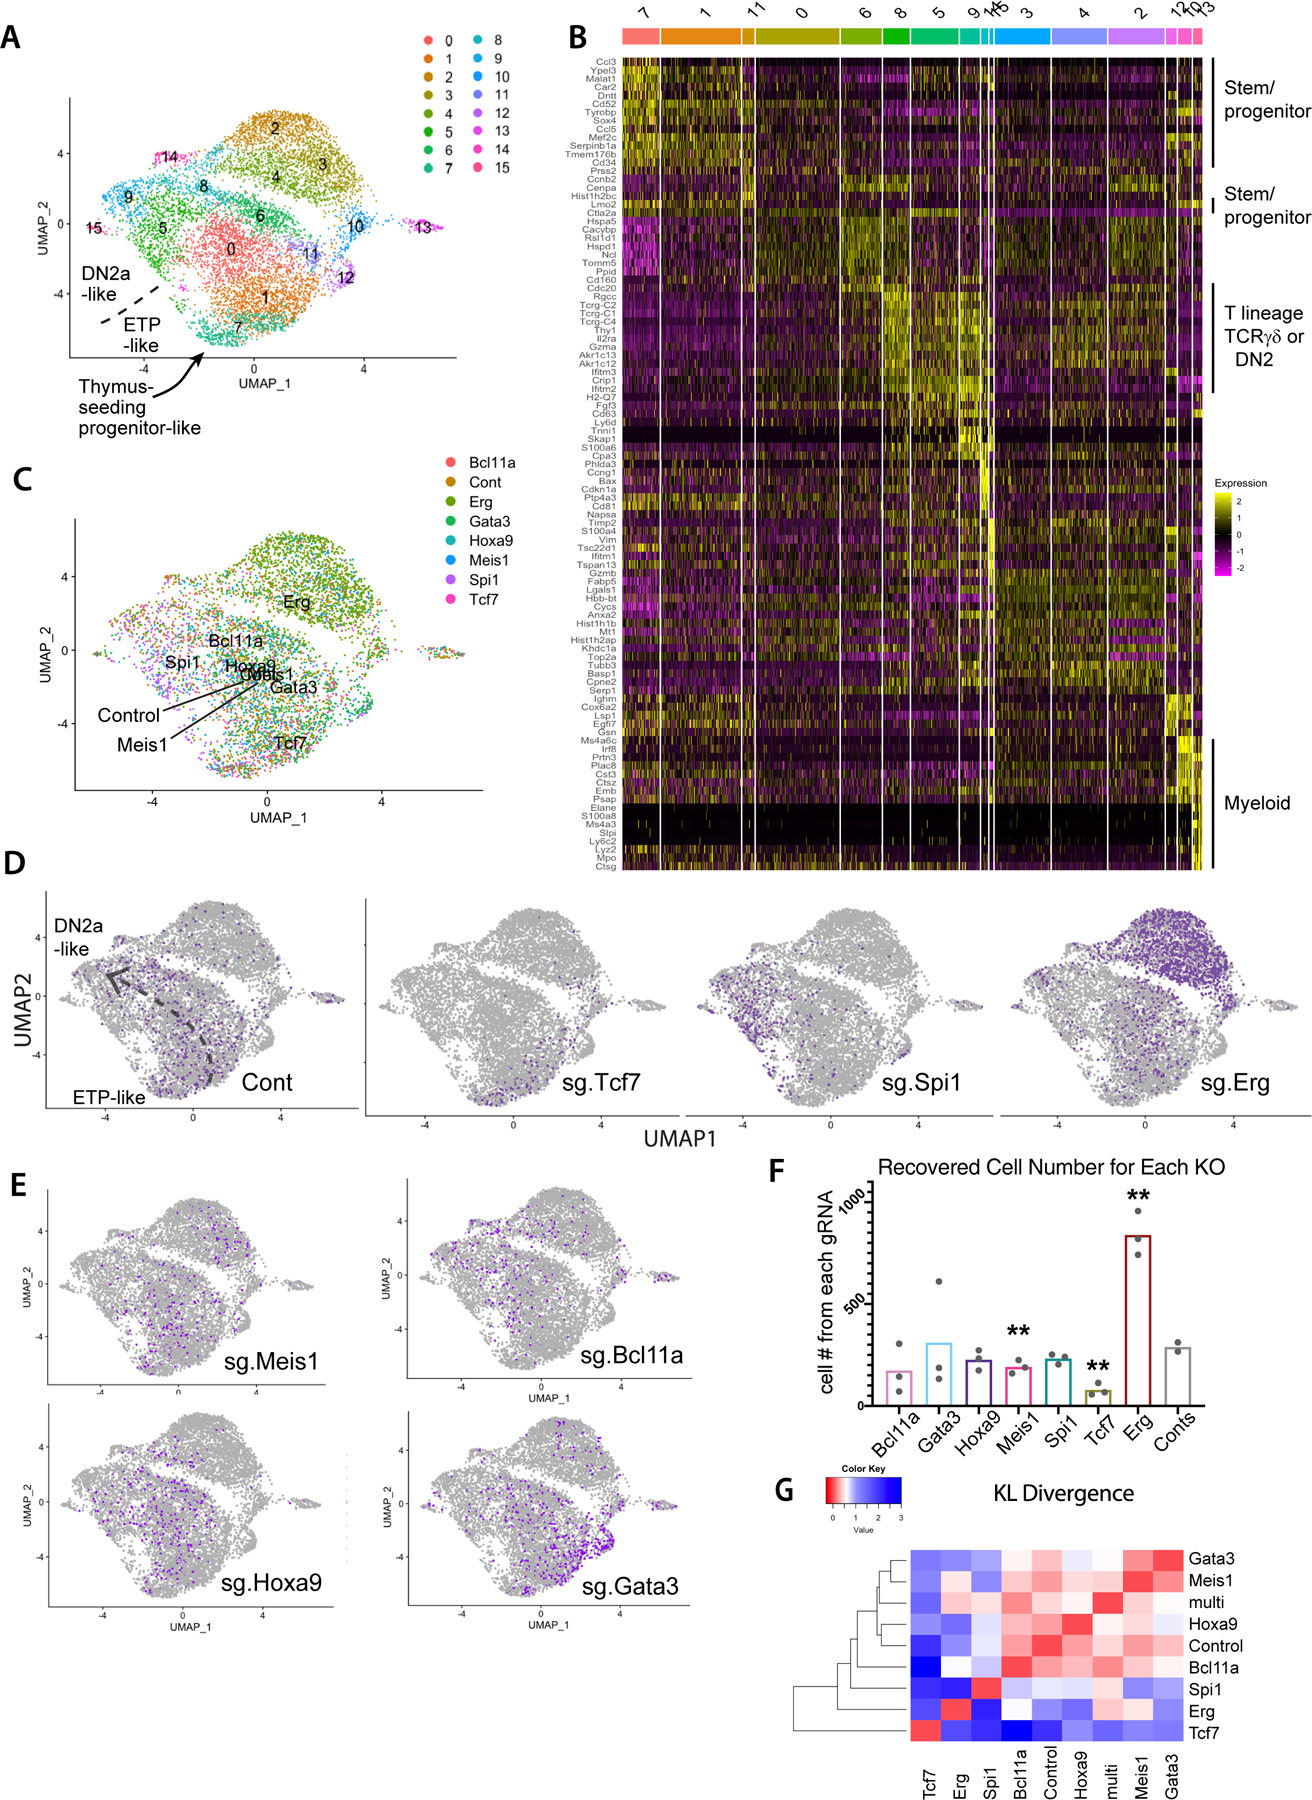
Fig. 2.

Impacts of transcription factor perturbations on gene expression, cell number, and differentiation trajectories of early pro-T cells. (A) UMAP plot of scRNA-seq data from total set of pool-perturbation samples, here based on PC 1–16. N= 5541 cells for singly assigned gRNA vector, N=8045 for total recovered single cells. The cells are colored by Louvain clustering algorithm. (B) Heatmap displaying the top 10 enriched genes in each sub-cluster, in approximate developmental order. Defined by Seurat 3 pipeline with minimum fraction of expressing cells ≥ 0.25, Wilcoxon rank sum test with avg_logFC threshold of 0.3, full list of genes in Table S2). (C-E) Cells in UMAP display, colored by sgRNA assignment. All cells with any of the 3 pairs of dual sgRNAs against the same gene are colored together. Number of cells of each KO: Controls (Cont.): 793, Bcl11a: 353, Erg: 2101, Gata3: 686, Hoxa9: 503, Meis1: 409, Spi1: 481, Tcf7: 215. (C) Merged representation of results with labels showing the centroids of different KO distributions on a UMAP plot. (D-E) Cells from the indicated KOs (purple dots in each panel) within the total sample (gray dots). The main consensus trajectory for the whole experiment is shown approximately on the “Cont” panel, manually sketched based on marker gene expression shown in panel (B) and Figure S4A. (F) Cell numbers recovered from the scRNA-seq pool. Each dot represents the cell number recovered from one of paired gRNA vectors against the indicated target. Statistical significance calculated in individual pairwise t-tests between Control and each of the KOs. (**: p-val<0.01, *: p-val<0.05). Raw data included in Table S12. (G) Heatmap of KL divergences of cluster distributions (red: high similarity; blue: low similarity) among WT and aggregated KO for each gene. Cluster distribution for each sample used in KL divergence calculation is provided in Table S12.
