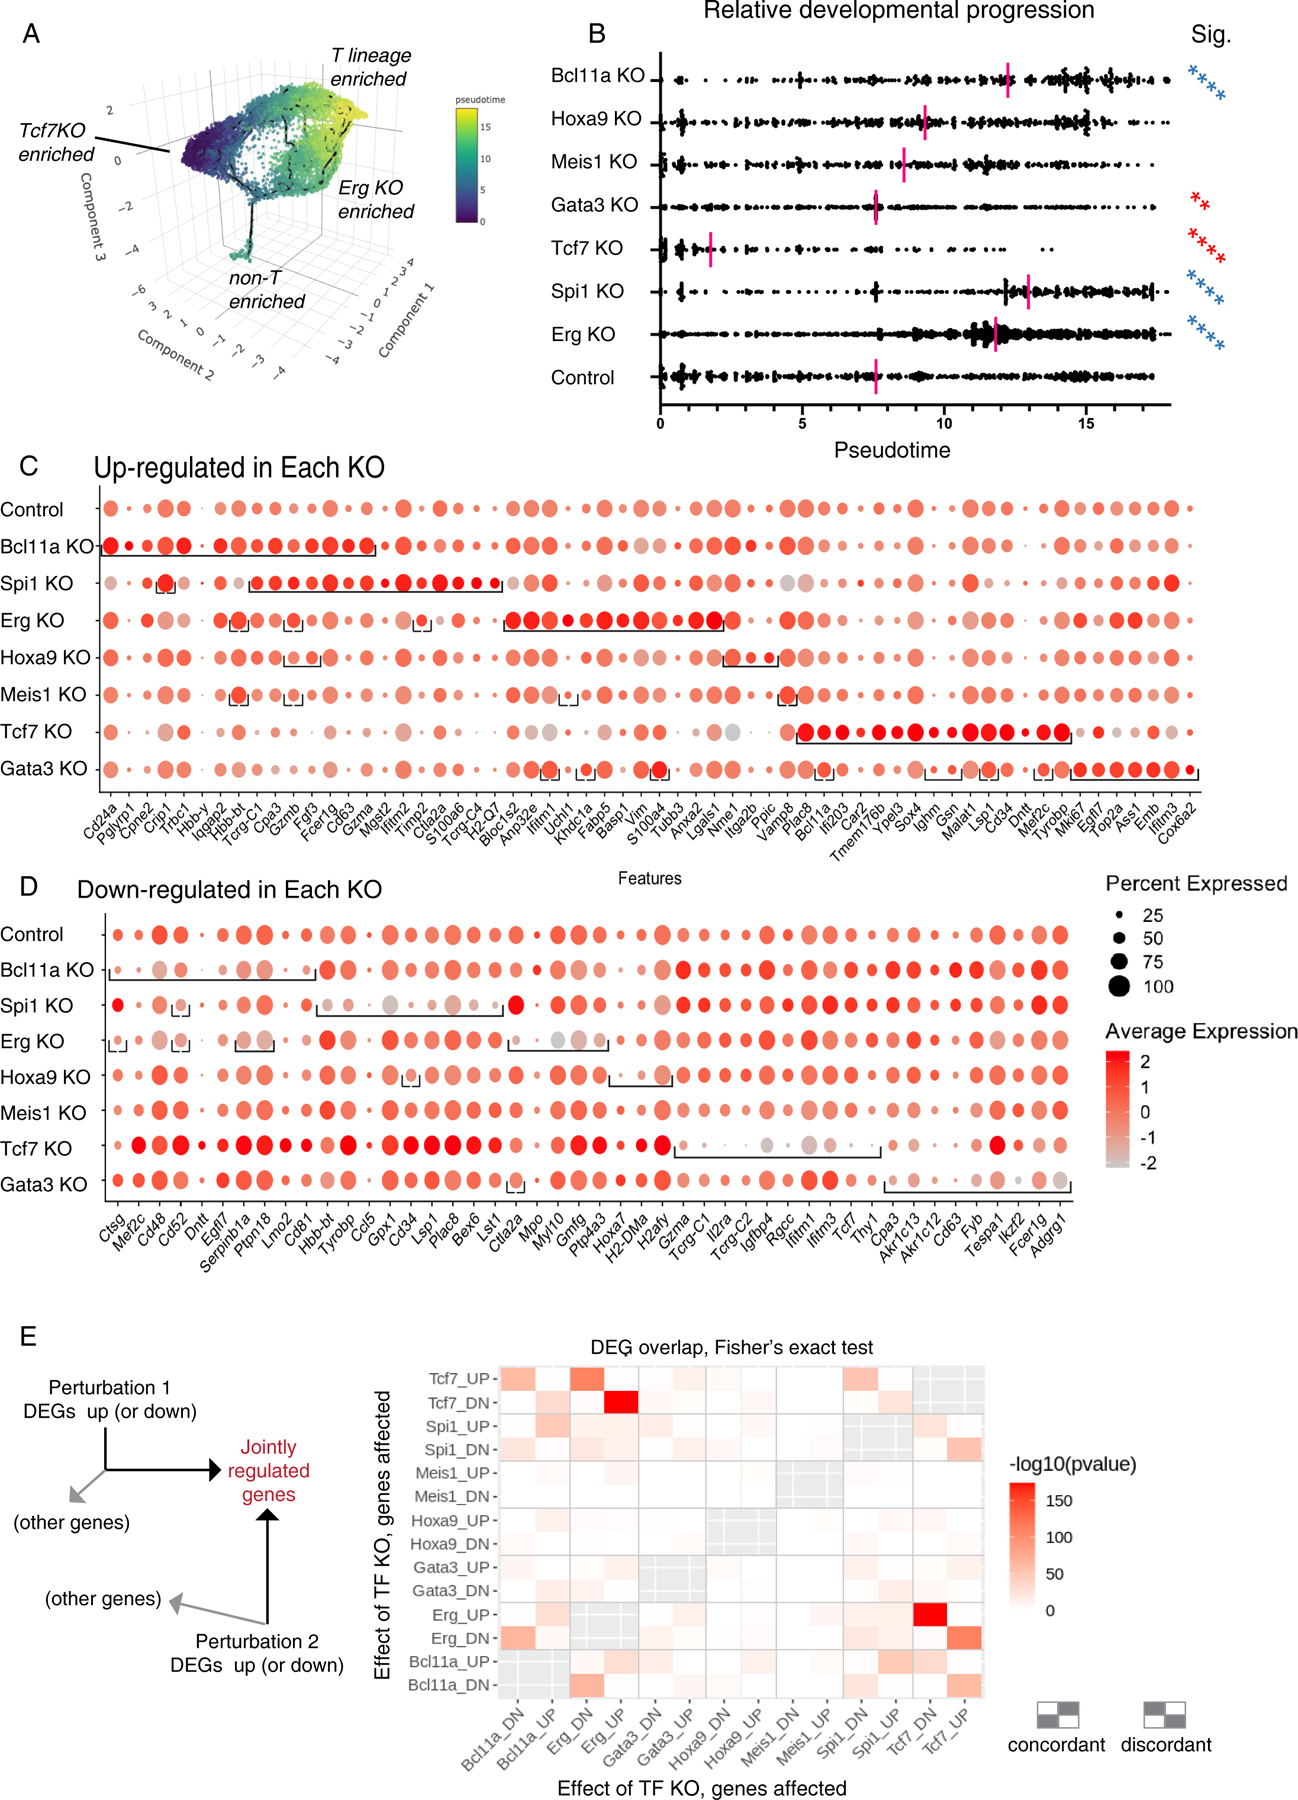
Fig. 3.

Impact of transcription factor knockouts on gene regulation, pseudotemporal progression, and discrete regulon modules in early pro-T cells. (A) 3D UMAP of all pool-perturbation samples, corresponding to 2D plot shown in Fig. 2A. Here, cells are colored by inferred pseudotime, to relate cells to a common overall pseudotemporal advancement score regardless of trajectories. The pseudotime was calculated with Monocle 3, based on the trajectory inference from 3D UMAP built using the size and cell cycle scaled data as described in Fig. 2A (see Supplementary Methods, Gene and Cell Filtering, Data Alignment, and Clustering Analysis). (B) Pseudotime distributions (x axis) of cells from the indicated KOs (category axis), with medians indicated (red bars). The small “non-T-enriched” population seen in (A) was excluded from the calculation. Statistical significance of comparisons, each KO to control, by Kruskal-Wallis test of multiple comparisons. **, adj.p-val < 1E-02; ****, adj.p-val < 1E-04. Blue asterisks: faster, red asterisks: slower than Control (Cont). (C-D) Genes highly differentially expressed between control and KOs, full gene lists in Table S3. (C) Top 15 up-regulated genes (columns) for each KO (row). In each row (each specific KO), brackets enclose the top differentially expressed genes for that KO. Order of columns: Top 15 genes for Bcl11a KO are followed by top 15 for Spi1 KO if not already listed, followed by top 15 for Erg KO if not already listed, etc. Note that 8 of the top 15 genes in the Spi1 KO are shared with the Bcl11a KO and so add only 7 new genes (columns) to total, whereas 12 of the top 15 genes for Erg KO are not shared with Bcl11a KO or Spi1 KO. Only Meis1 KO and Hoxa9 KO did not define 15 significantly upregulated genes. Top 15 was defined by avg_logFC function on Seurat 3-processed data. Significance determined by Wilcoxon Rank Sum test, minimum expression fraction ≥ 5% cells in either the control or the KO, average “log expression” difference ≥ 0.1 (ln, baseline pseudocount=1), and adjusted p-val < 1E-02. (D) Top 10 down-regulated genes in each KO, with conventions as in panel (C), with average “log expression” difference ≤-0.1, and adjusted p-val < 1E-04. (E) Pairwise comparisons of top differentially expressed genes in each condition, determining to what extent different KOs may affect common target genes either in the same way (concordantly) or in opposite ways (discordantly); pvalues calculated by Fisher’s exact test. Left schematic shows that the chart depicts the intersection between genes increased (UP regulated) or decreased (DOWN regulated) by the perturbation shown on the y axis, and genes UP or DOWN regulated by the perturbation on the x axis. The top left rectangle, e.g., shows the enrichment of genes that are both increased in expression by the Tcf7 KO and decreased in expression by the Bcl11a KO. Other genes affected by an individual KO but not included in the intersection are not depicted. Right schematic: patterns of concordant or discordant regulation.
