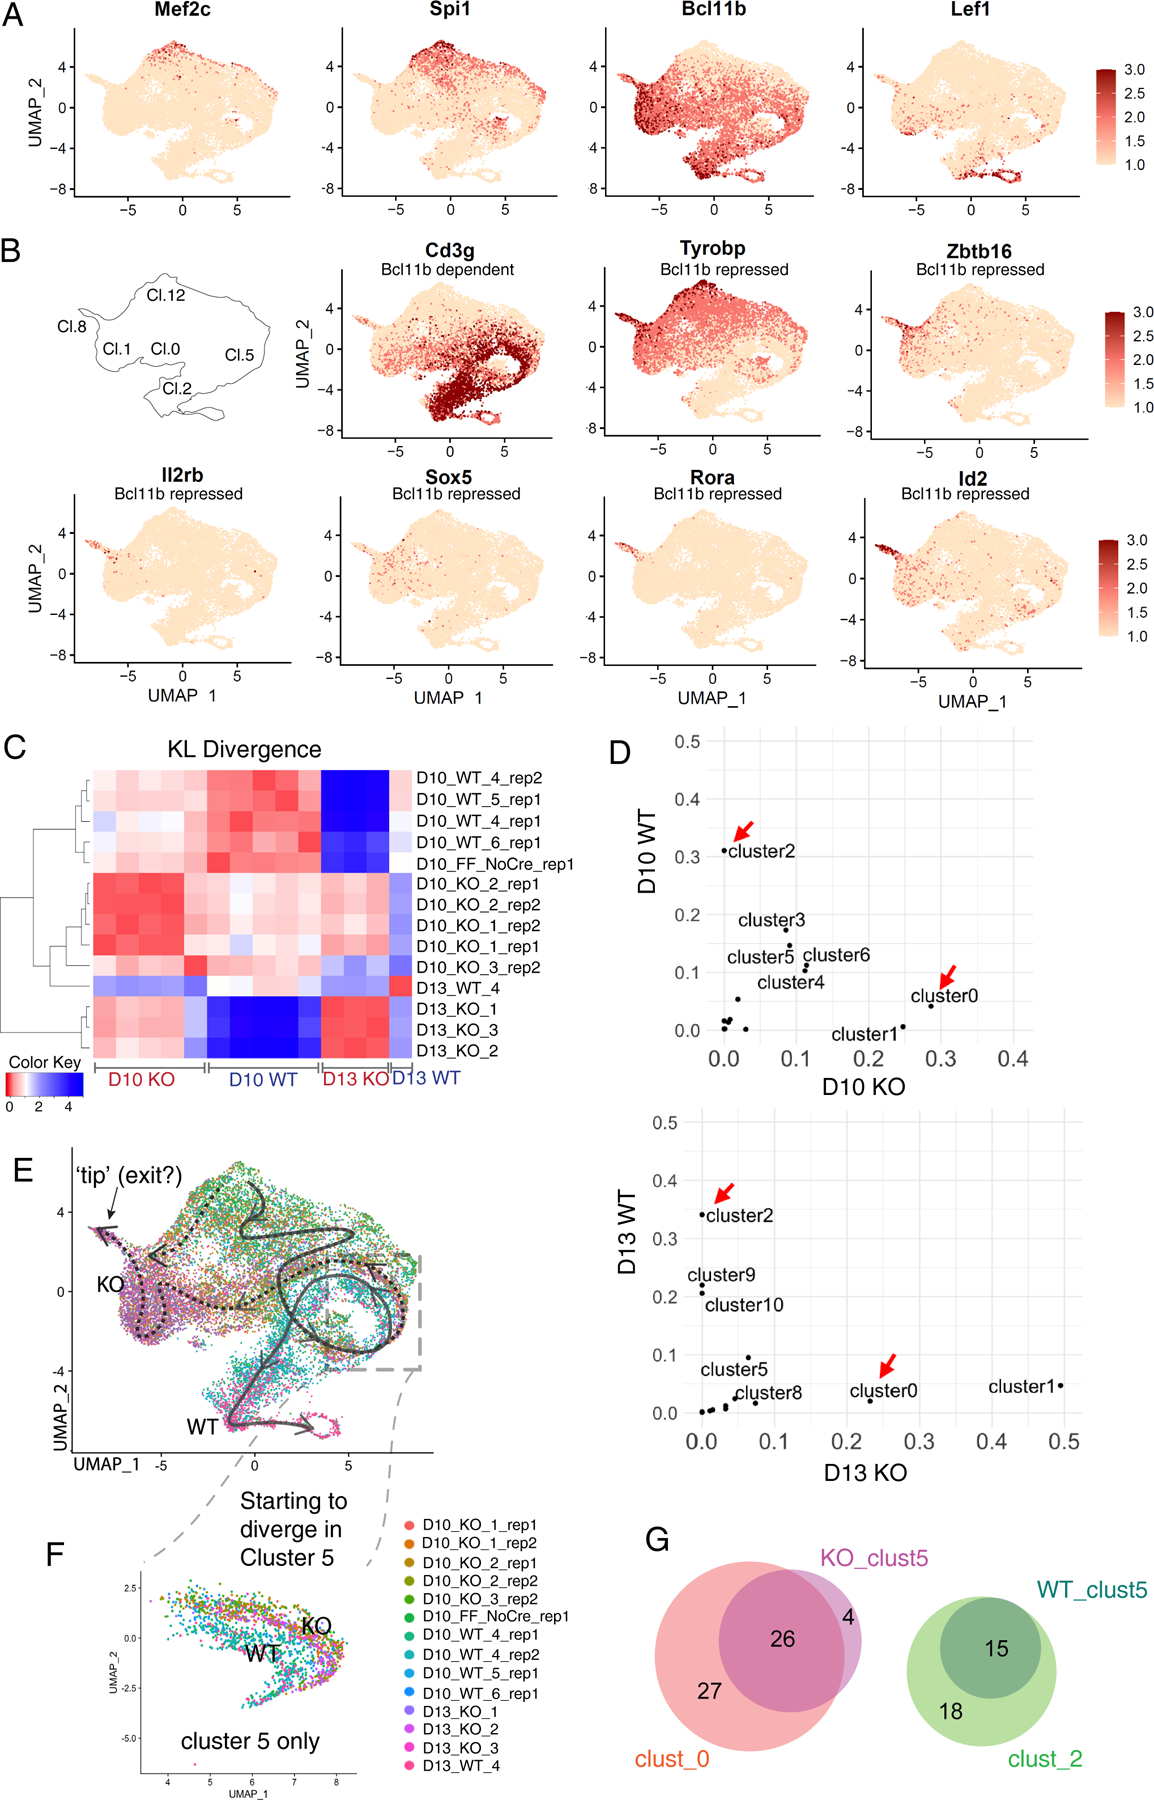
Fig. 6.

Single-cell analysis of differences between Bcl11b KO and WT: WT and Bcl11b KO trajectories separate immediately after the normal onset of Bcl11b expression. (A, B) Expression patterns of indicative genes in UMAP 1–2 plots of whole WT and Bcl11b KO data ensemble. (A) Genes indicating degrees of progression in the normal pro-T cell pathway. Note that transcripts from Bcl11b locus are detected even from mutant allele. (B) Genes distinctively regulated in Bcl11b KO as opposed to WT cells, with reference to cluster locations on UMAP plot. Cd3g: a representative Bcl11b-dependent gene. Tyrobp, Zbtb16: representative Bcl11b-repressed genes with some normal expression before commitment. Il2rb, Sox5, Rora, Id2: genes with minimal normal expression before commitment, activated selectively in Bcl11b KO. (C) Heatmap showing the KL divergences among all of the integrated samples, calculated based on correlations between cluster distributions, as shown in Fig.5C (Table S6B). Between the two experiments, there were 5 WT control samples (Bcl11b+/+ Vav1-iCre+), 8 KO samples (Bcl11bf/f Vav1-iCre+), and one Cre-negative control (Bcl11bf/f without Cre; “FF_NoCre”). (D) Pair-wise cluster distribution scatterplots comparing WT and Bcl11b KO. Data were from Bcl11b_run2, where the two timepoints were collected from each of the same donor inputs (see comparison, Fig. S8C–F). Pearson correlation r= −0.04 for D10, r= −0.18 for D13. Red arrows indicate the most dramatic and consistent differences between the two genotypes in both time points, cluster 0 and 2. (Raw cluster distributions for each sample in Table S6b). (E-F) UMAP 1–2 colored by individual demultiplexed samples. (E) Schematic, overview of inferred trajectories of differentiation of WT and Bcl11b KO cells around stages of commitment. Solid arrow, trajectory of wildtype cells. Dotted arrows, trajectories followed by Bcl11b KO cells after branching off from main trajectory. See panel (B), key, for cluster numbers. Dashed box, region of UMAP containing proliferating cells (cluster 5 in Fig. 5C) where most divergence appears to occur. Most Bcl11b KO cells follow the horizontal right-to-left path from cluster 5 through clusters 0 and 1, but our data leave open the possibility that an additional minor pathway may exist for some Bcl11b KO cells (dotted downward arrow along the left-hand edge of UMAP plot). (F) Zoom-in view of subset of cells only within cluster 5 from Fig. 6E, with the color of cells showing the slight separation between genotypes. This separation is also indicated in panel (B) by comparing patterns of expression of Cd3g (Bc11b dependent) and Tyrobp (Bcl11b repressed) in this part of the UMAP plot. N=1630 cells. (G) Proportional Venn diagrams comparing genes showing differential expression between WT and Bcl11b KO within cluster 5 (WT_clust5, KO_clust5)(heatmap comparison in Fig. S9D), with the genes showing differential expression between the strongly divergent clusters 0 (KO-specific) and 2 (WT-specific; heatmap comparison in Fig. S9C).
