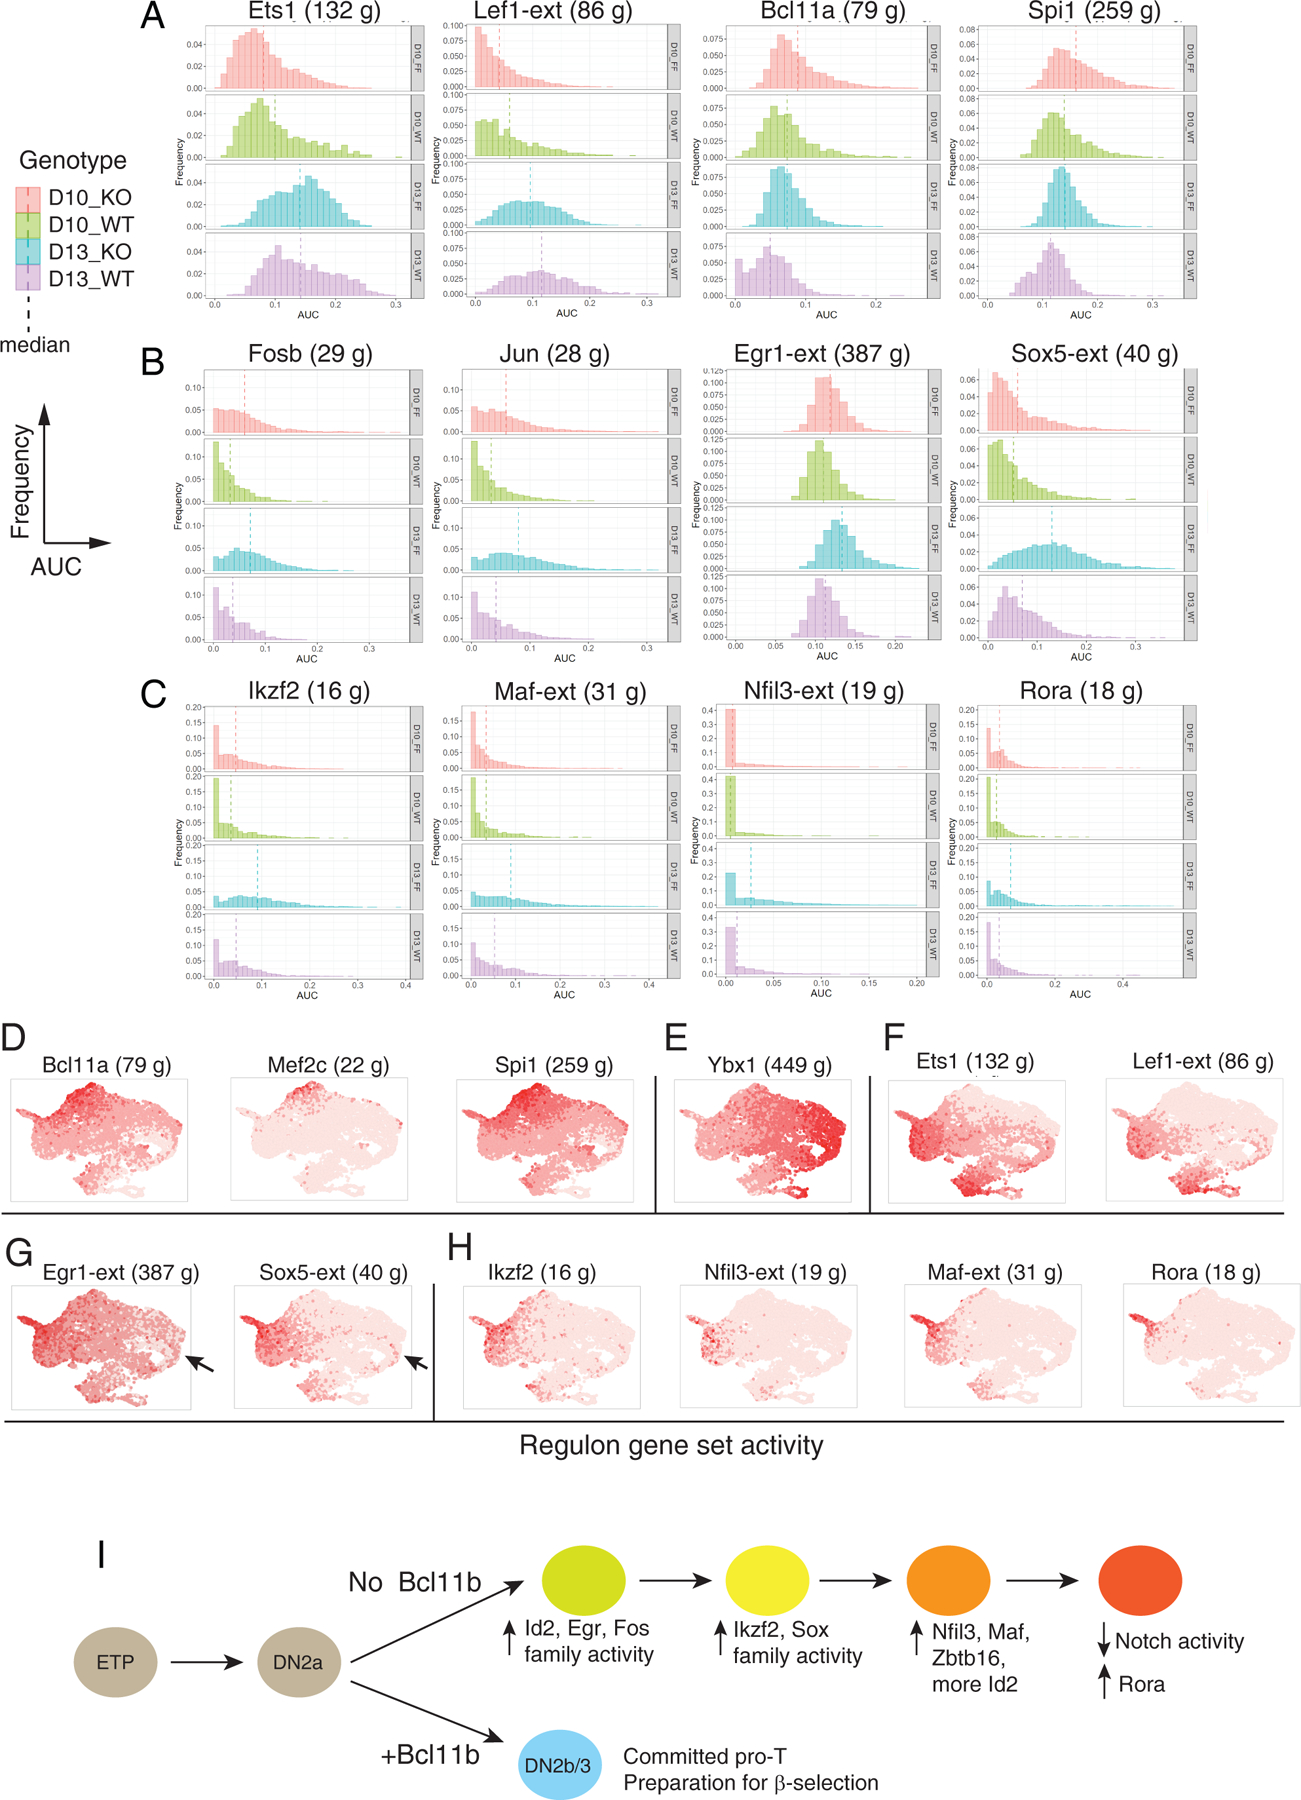
Fig. 7.

SCENIC analysis of Bcl11b KO impact on gene expression (A-C) Histograms of expression enrichments for indicated regulons, comparing cells from Bcl11b KO (FF) and WT controls (WT) at D10 and D13. Frequency (Y axis) plotted vs. regulon activity (AUC, X axis), means shown by vertical dashed lines. N cells for each sample: FF10 = 3236, FF13 = 3100, WT10 = 1075, WT13 = 1147, all from second experiment to avoid integration introduced data scaling. Full regulon data of individual sample, regulon gene lists and Kolmogorov–Smirnov tests are given in Table S8. (A) General developmental progression indicators: Ets1 and Lef1 activities increasing, Bcl11a and Spi1 activities decreasing with development. (B) AP-1-associated (FosB and Jun), Egr1 (immediate-early response) and Sox5 (TCRγδ-associated) regulons. (C) Ikzf2, Maf, Nfil3, and Rora regulons, showing increasing activity in Bcl11b KO after D10 and/ or concentrated in candidate terminal state. (D-H) Developmental distribution of regulon activation states, shown in UMAP plots of integrated WT and Bcl11b KO cells, colored with intensities showing relative activities of the indicated regulons. (D) Stem/ progenitor regulons (cf. Fig. 4A, Fig. S6A). (E) Cell cycle-associated regulon Ybx1 (compare Figs. S6, S7). (F) Developmental progression-associated regulons (compare panel A). (G) Egr1 and Sox5 regulons (compare panel B). Arrows indicate early-appearing bias of these regulons to Bcl11b KO subset of cluster 5 cells. (H) Other Bcl11b KO-induced regulons (compare panel C). (I) Proposed pathway of transcriptional regulatory cascade leading Bcl11b KO cells to alternative developmental endpoint, inferred from Figs. 6, 7 and Fig. S10. The earliest changes detectable in Bcl11b KO cells at D10 include increases in Fos, Jun, and Egr1 regulon activity and Id2 expression. Upregulation of Ikzf2, Sox5, Zbtb16, Nfil3, and Maf begin later, based on regulon activity and gene expression. A hypothetical order of activation is shown, based on D10 to D13 changes in activities of these regulons and on the positions of the expressing cells in the UMAP plots, along the right-to-left trajectories for Bcl11b KO cells shown in Fig. 6E and Fig. S10A, B. Id2 gene expression is seen initially in the D10 cluster 5 bifurcation between Bcl11b KO and WT cells (right side of UMAP plot, see Fig. 6B and F) but then begins to increase again from D10 to D13 as KO cells move further to the left of the UMAP plots, reaching a maximum in the terminus of the Bcl11b KO pathway (cluster 8, ‘tip of exit’). At this terminus of the Bcl11b KO pathway, at D13 the cells finally upregulate Rora and shut off Notch signaling, thus exiting from the T-cell pathway.
