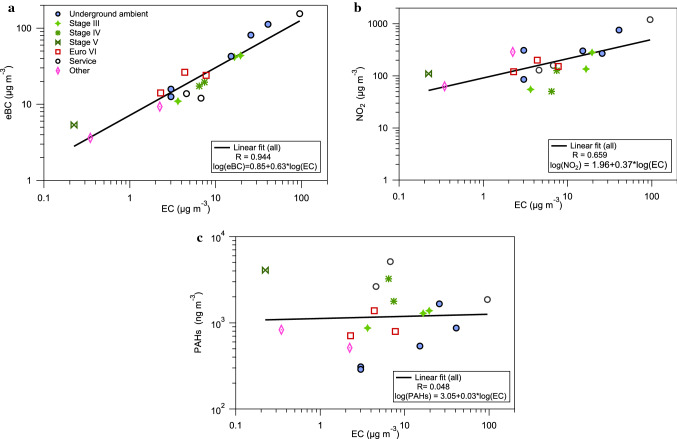
Fig. 3.
Correlations in underground ambient zones and PBZ between a eBC, b NO2, and c PAH concentrations and EC concentrations. The measurements in PBZ are divided into several subgroups denoting the emission standards of the mining vehicle they operated in the drift (Stage III, IV, V or Euro VI). The “Service” group worked with tunnel maintenance. PAHs are the sum of the 16 US EPA PAHs. The data were log transformed and the lines show the linear regression model. The correlation was statistically significant for eBC (R = 0.94; p < 0.001) and for NO2 (R = 0.66; p = 0.002). No statistically significant correlations were found between PAHs and EC (p > 0.3). NO2 and PAHs were measured with passive sampling techniques, EC was measured with an offline filter-based method, and eBC with highly time-resolved instrumentation (micro-aethalometer). No repeated measurements are included in this figure, and for the three miners in which we measured on two consecutive days (Table S2) the average values are used

