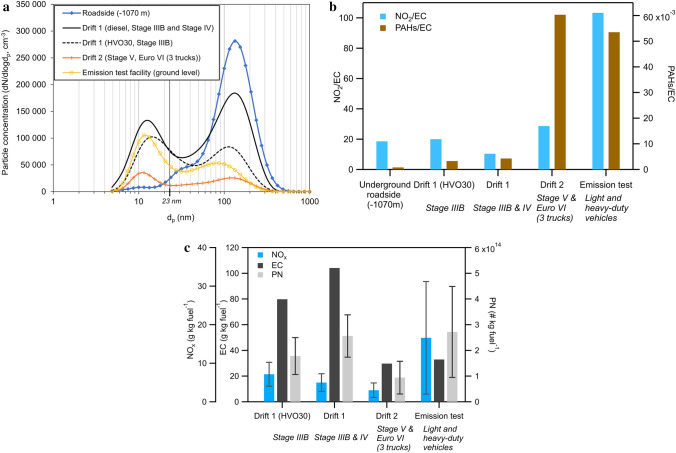
Fig. 6.
a The average particle number size distribution measured in the stationary ambient zones concurrent with the PBZ measurements (around 7.5 h) at the roadside, the two drifts, and at the emission test facility (ground level). The measurements in the emission test facility were measured over 3 h. In b, the ratios NO2/EC and PAHs/EC are shown for all ambient zones. PAHs are the sum of the 16 US EPA PAHs. c Average real-world emission factors (per kg fuel) of NOx, EC, and PN (measured as the soot mode concentration, which approximates the solid fraction of PN > 23 nm) in the drifts and at the emission test facility. The error bars in (c) represent ± 1 std. dev. of the variation throughout the measurement day (not available for EC)

