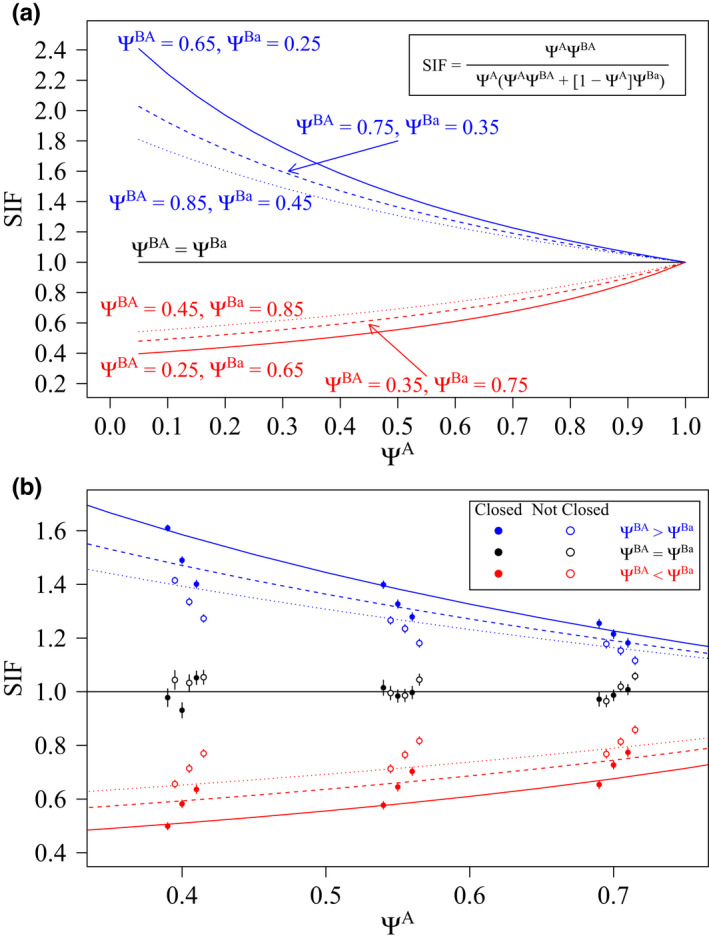
FIGURE 3.

(a) Expected species interaction factor (SIF) for simulated combinations of occupancy for Species B, given that Species A was present (ΨBA) or absent (ΨBa) from a site under patterns of avoidance (red), aggregation (blue), or independence (black) as a function of the occupancy for Species A (ΨA); and, (b) mean estimated SIF (±1 standard error) for simulations where the most‐supported model provided support for a lack of independence (i.e., avoidance or aggregation) when sites were closed (solid circles) or not closed (open circles) to changes in occupancy state and sampling occurred at N = 250 sites. For each simulated level of ΨA when sites were closed (or not), results for combinations of ΨBA and ΨBa are presented from left to right by increasing the value of ΨBA. Results are presented based on encounter histories at a fine‐scale resolution
