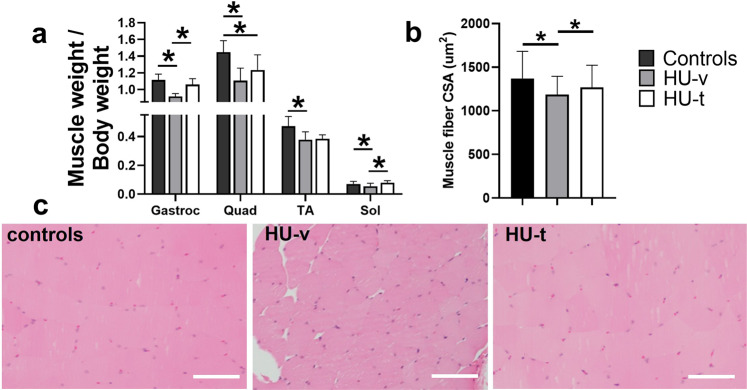
Fig. 3. Muscle mass and fibers size.
The relative masses of hindlimb muscles, including gastrocnemius, quadriceps, tibialis anterior (TA), and soleus (a), and single fiber cross-sectional areas (b) and hematoxylin & eosin images (c) of the gastrocnemius muscles in ground-based control and the hindlimb-unloaded mice treated with vehicle (HU-v) or 4-PBA (HU-t). Data is presented as mean ± SEM; One way analysis of variance, *p < 0.05 (n = 6–11/group) (scale bar = 50 µm).

