
Fig. 3. Comparison of NAbs after 2nd dose of either mRNA-1273 or BNT162b2.
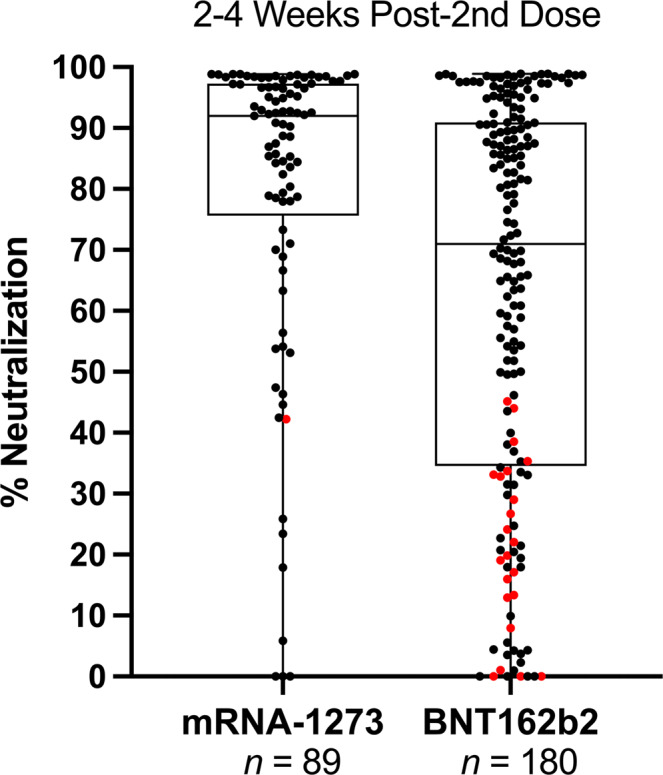
% Neutralization (y-axis) indicates NAb levels ranging from 0 to 99% neutralization. Data shown as box and whisker plots with black vertical lines that denote upper and lower extremes, and horizontal lines that denote upper and lower quartiles with median at the midline. Median neutralization of mRNA-1273 (n = 89) and BNT162b2 (n = 180) is 92% and 71%, respectively. Mean neutralization for mRNA-1273 and BNT162b2 groups is 80% and 63%, respectively. Red dots indicate VPRs that received a 3rd vaccine dose as shown in Fig. 2B, demographics in Table 2.